What Futures Traders Should Know About the Commitment of Traders Report (COT), Part 2
In Part 1, Floyd Upperman explains the Commitment of Traders report and how traders can use the report to determine buy and sell points for trading more efficiently. To read part 1, click here.
Conclusion
In recent years there has been some rumors floating around that the COT report was about to be pulled. I have talked with the CFTC about this and I have talked with others who have talked to the agency about this as well. My understanding is that the CFTC has no plans to pull the report. And in fact, their latest upgrades strongly suggest they are doing just the opposite. Rather than pull the report they are improving it and making it better.
The new disaggregated COT report addresses many issues associated with changing market dynamics. In just the last ten years, trading in the old open outcry trading pits has dried up. Fewer and fewer of the open outcry markets remain and most markets are traded on electronic exchanges via electronic platforms. These changes are also opening up markets to larger customers (pension funds for example) and on a global scale as well. More and more money is likely to continue pouring into these markets during the next few decades. The new improvements in the COT report have been necessary to address these changes and to keep the report valid into the 21st century.
The recent adjustments to the COT report have effectively re-aligned the commercial category with the original intention, to provide transparency into commercial hedging. In addition the new changes also provide transparency into one of the fastest growing areas of the market and that is the swaps. As such, the advantages of incorporating COT data into a trading system remain as strong as ever and, with the recent improvements described here, are probably even greater.
Trading Strategies using COT Data
Provided below is an example of a setup trade in Wheat during late 2005 and early 2006. The setup is for a buy. The completion of the setup relies on having both a COT trigger along with specific price criteria that confirms a change in price trend may be underway.
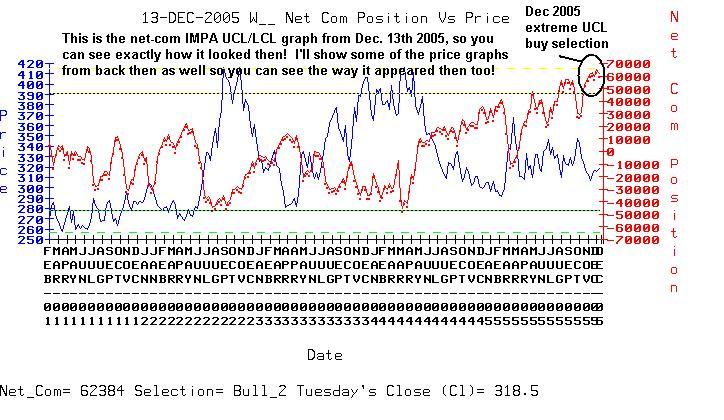
The first step in our trading system (called ‘IMPA’) involves an extreme position held by the commercial hedgers. When the net-commercial position exceeds a specified limit (the Upper-Commercial Limit in this case) a buy selection is triggered. Once this happens we turn our attention to the price behavior and begin looking for signs of an impending change in trend, which in this example was a double bottom / “W” pattern. Below is a chart that explains the initial trigger for the buy in Wheat.
Figure 4.
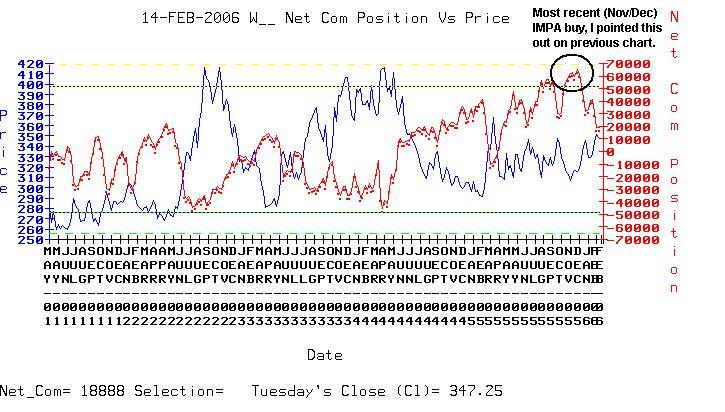
This is what the trigger graph looked like on February 14th 2006 after the trade had been established and the new upward price trend was underway.
Figure 5
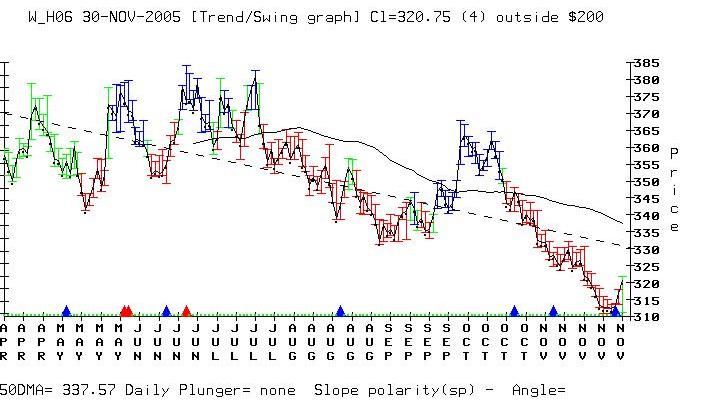
This is one of our daily price studies in Wheat on November 30th 2005. You can see that the new price trend had not been established yet.
Figure 6.
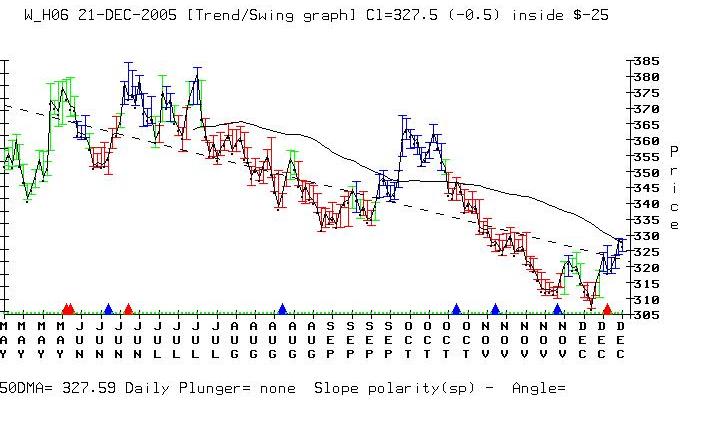
This is the same graph, with the date now December 21st 2005. Here we can see a “W” price pattern has formed. The “W” price pattern is a pattern we like to see during buy selections because the price-low has already been tested once. The “W” pattern also provides an excellent logical stop (an exit if the new trend fails to unfold). We can see that the “W” lows are holding and a new price trend appears to be unfolding. The black line just above the blue closing price bars is the 50day moving average.
Figure 7.
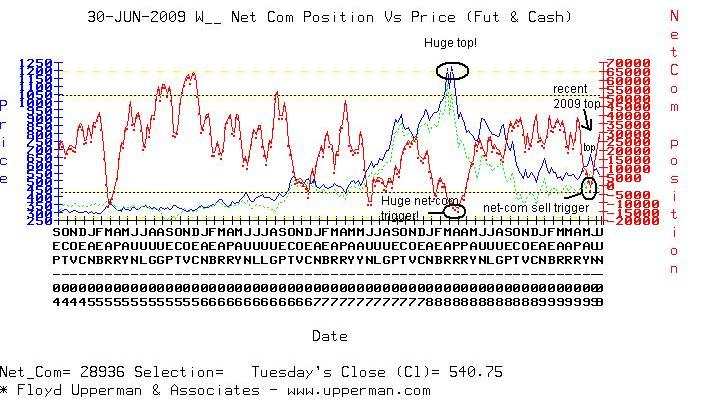
Below is a more recent (June 2009) updated net-commercial study in Chicago Wheat
I’ve circled two sell trigger selections. The first one (*huge top) occurred in 2008 and the other one at the end of June 2009.
Figure 8.
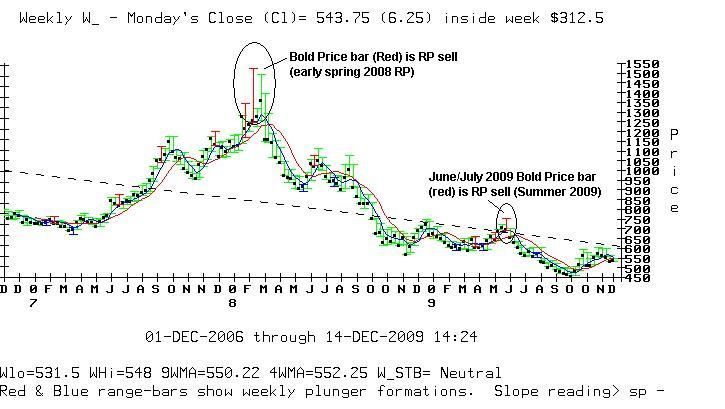
The graph below is our weekly price graph for Wheat. Here I have circled two price indicators that gave us sell signals during the time of the trigger selections noted in the net-commercial graph above. These red price bars occurred in conjunction with the extreme commercial sell triggers.
The red price bars are a proprietary indicator known as weekly Reverse Plunger (RP) formations.
Figure 9.
The charts and market studies contained in this report are part of Floyd Upperman & Associates trading systems. Floyd Upperman COT trading systems, COT charts and all market studies are available and accessible to members of Floyd Upperman & Associates website .
Floyd Upperman is President of Floyd Upperman & Associates (www.upperman.com) and author of Commitments of Traders: Strategies for Tracking the Market and Trading Profitably. He is a registered full time commodity trading advisor, private investor & futures trader. Floyd is recognized throughout the world by a growing audience of professionals for his work with the U.S. government Commitment of Traders data or COT.
Click here to sign up for a free, online presentation by Larry Connors, CEO and founder of TradingMarkets, as he introduces The Machine, the first and only financial software that allows traders and investors to design and build quantified portfolios.
