
What I See In Semiconductor HOLDRs
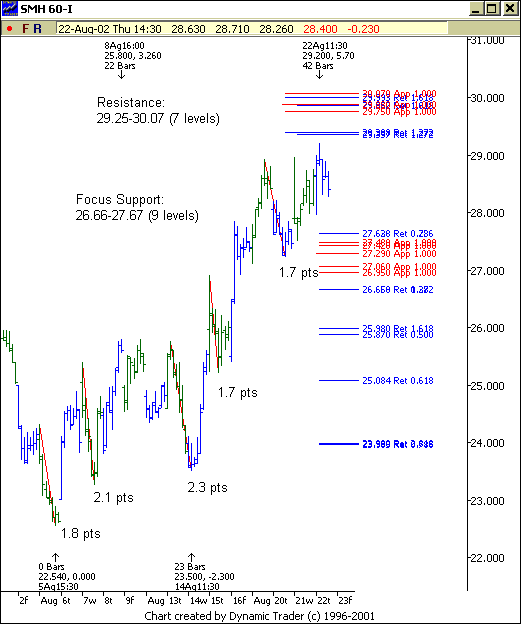
This ETF has risen from
a low of 22.54 on August 5 (which by the way reversed against a key Fibonacci
price support zone and symmetry – see August 5 commentary), to a high today
of 29.20. Below is a 60 minute chart of
(
SMH |
Quote |
Chart |
News |
PowerRating). Here is what I see:
1) Nice immediate uptrend
2) Each pullback along
the way has been between 1.7 points and 2.3 points
3) If the current high
holds, the focus support decision is from 26.66-27.67 4) The focus resistance
above is from 29.35-30.07
So, taking long trades against
support zones makes sense right now as the immediate trend is up. However, if
our focus support zone is broken (and this support zone changes as we make new
highs), I will back away from the long side as the longer term daily and weekly
downtrend would be taking over again. For now, let’s enjoy what the market is
giving us on the long side.
Â
Good night!
Â
Â
Â
Â
Â