What’s Up, What’s Down: Buy Signals for Crude Oil
Comments for Friday, February 26, 2010
Looking Ahead to Today by Reflecting Back at Thursday’s Price Action
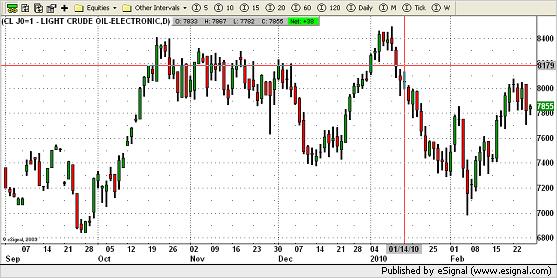
ENERGIES:
Lower closes for the crude and heating oil along with the rbob and natural gas but no changes technically. The crude, heat and rbob are still in uptrends but we will have to closely watch to see what kind of follow through will result if any. Although I have buy signals in the crude, heat and rbob, they haven’t been able to get through heavy overhead resistance which may eventually be their downfall. Gas made its lowest low and close since early December and is closing in on contract lows. Buy Signals for crude, heating oil and rbob; Sell signal for natural gas. Please email me for a copy of my latest report on Crude Oil.
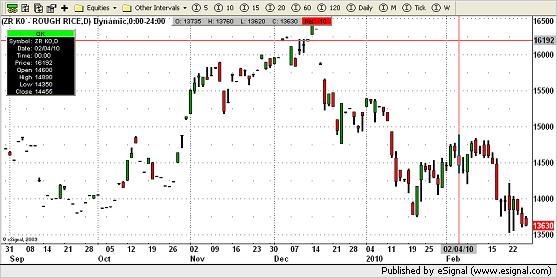
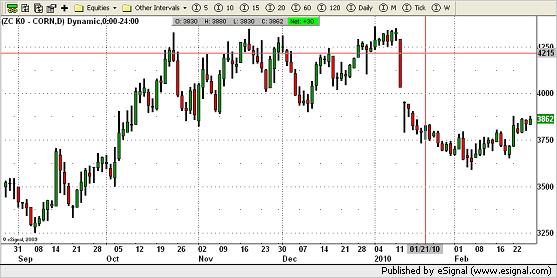
GRAINS:
Higher for corn, Minneapolis, Kansas City and Chicago wheat along with soybeans and soyoil while lower for oats, rough rice and soymeal. All of the wheat are still holding their respective support areas with my buy signals intact. Corn gave me a buy signal on the 22nd of January which I forgot to change at the end of the grain comments below until today. I do want to apologize for my error. Corn closed higher which continues to show me how strong this market is in the face of bearish news throughout most of the grain producing countries. Still expect choppy markets going into the growing seasons for most of the grains. Corn has a gap at 403 in the May contract and as I mentioned many times before, throughout history grains fill over 90% of their gaps sooner or later. Rice settled lower still is in a major downtrend overall while oats also settled lower for the fifth consecutive trading session making its lowest low since January 22nd back to continuing its downtrend since the middle of November now giving me a belated SELL SIGNAL. The beans and oil settled higher while meal closed lower and my sell signals are still intact.
Read the balance of my morning comments, including the Metals, Softs, Energies and Grains, at my website. For my complete coverage, visit my commentary page at www.markethead.com.
Rick Alexander has been a broker and analyst in the futures business for over thirty years. He is a Vice-President for Sales and Trading at the Zaner Group (www.zaner.com) a Chicago-based futures brokerage firm. If you would like a free booklet explaining the charts mentioned above, email Rick at ralexander@zaner.com.
The information in this Report and the opinions expressed are subject to change without notice. Neither the information nor any opinion expressed constitutes a solicitation by Rick Alexander or the Zaner Group of the purchase or sale of any futures or options. Futures and options trading is speculative in nature and involves risks. Spread trading is not necessarily less risky than outright positions. Futures and options trading is not suitable for all investors.