Why EUR/JPY is about to get interesting
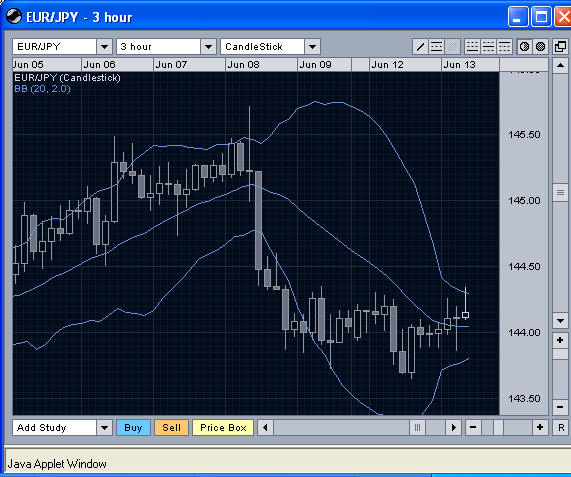
Take a look at the 3-hourly chart of EUR/JPY
below. It features Bollinger Bands overlaid. Something quickly stands out. The
Bands have gotten extremely narrow in the last half day. This is after being
extremely wide as the result of the crosses sharp drop from about 145.50.
The reason this is something worth noting is that
narrow Bollinger Bands are generally a sign that the market is ready to do
something interesting – to start a new directional move. That being the case, it
becomes a question of trying to figure out which way things are going to go.
The daily chart can help a bit in that regard. As
the chart below indicates, the situation in the longer time frame is a little
different. The sell-off of the last few sessions has pulled EUR/JPY down to the
20-day moving average (middle line) and the Bollinger Bands are contracting. We
appear to be in something of a consolidation phase. If the market holds up above
about the 143.50 level, we would expect a rally back to at least test the recent
highs.
How quickly such a bounce moves the market back
up to 145.50 could actually be a good indication of whether there is likely to
be much beyond that. A slower build could help the market consolidate enough to
allow for the launch of a significant new leg higher. If we just see a jump over
the course of a couple of days, though, it would be more likely that such a
rally would be short-lived.
John Forman is the author of
The Essentials of Trading
(Wiley) and a near 20-year veteran of trading and investing across a wide array
of markets and instruments. He is also Managing Director & Chief Trader for
Anduril Analytics. His daily market
commentary and analysis can be found in the
Anduril Trading Report.