Why I’m bullish on the Dollar
FX: The
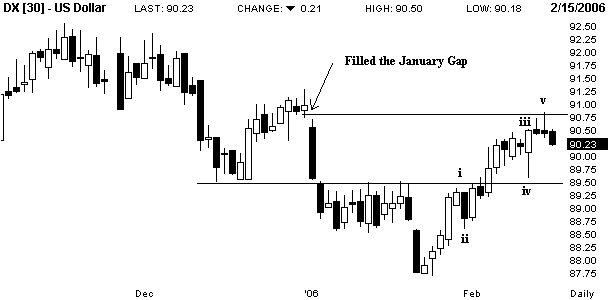
dollar has suffered a small scale ABC type correction from yesterday’s highs
after it “filled the gap” from January’s heart attack drop (see below). This is
usually where markets end their run and this pullback may either be the start of
a larger correction at hand following a “five wave” move up over the past 4
weeks, or it may be a minor degree correction before higher highs complete the
said “five wave” move. We think the failure to rally on Bernanke’s comments
today hints that the five wave move is completed. Either way we are only looking
to add to our dollar positions on a dip.
Readers should also recall that we continue to
“see-saw” in and out of dollar longs and shorts mainly via USDCHF (for longs)
and AUDUSD (for shorts). On February 8 we wrote in our MMC, “We added to our
long AUD/USD position at 0.7370 today. Recall that we were buyers on January 3
at 0.7350 and then took 1/2 profits at 0.7525 just as we were buying a large
amount of USDCHF at 1.2720 to hedge our Aussie position. This does not mean we
are bearish on US dollar. We simply have identified this as a good area to
purchase AUD/USD for the “medium term” trend as we foresee a move to 0.80
sometime this year.” **We have sell limits for this position today at 0.7440 and
trailing stops at 0.7425 while maintaining the core position from Jan 3 at
0.7350.**
When asked by the media last year about Bernanke
we said only one thing – that there was a 100% chance of a rate hike in his
first meeting to establish his credibility to the markets. Today’s comments
appear to confirm this view whether he shrouds it in economic babble or not. But
perhaps most interesting was that yesterday the dollar failed to sustain a rally
off of a surge in retail sales. So today’s lack of upside progress on Bernanke’s
comments may mean that the “five wave” move is finished (see below). Regardless,
the comments are VERY bullish for the dollar near term so we will be buying the
dips….yet again.
As we said on February 3, “A sustained move above
1.30 (the previous breakout level from October) would be the best indication
that we are moving to profit taking Zone #1 in the 1.32/33 area where one would
look to take some money off the table, wait for a reaction and possibly add to
the existing position on a pullback.” With today’s move to 1.3140 we are moving
nicely to this initial target zone.
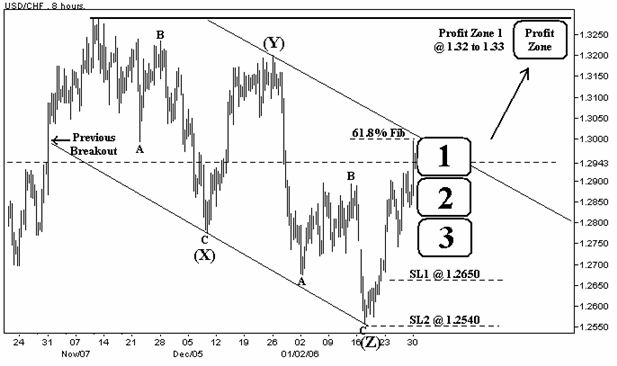
To clarify, we list below our trades with some
updated comments.
Jan 3: Short USD/MEX @ 10.63 — Looking to add at
higher levels possibly.
Jan 3: Long AUD/USD @ 07350 — Closed 1/2 @ 0.7525. Added back at 0.7370 and
looking to exit.
Jan 6: Long USD/CHF @ 1.2720 — Added at 1.2800. Then again at 1.2920, and again
at 1.3010.
Jan 9: Long USD/CAD @ 1.1660 — Added at 1.1415 for an averaged rate of 1.1575.
Jan 12: Long USD/JPY @ 113.70 — Closed out at 116.30 as indicated.
Jan 27: Long GBP/USD @ 1.7825 — Closed at cost.
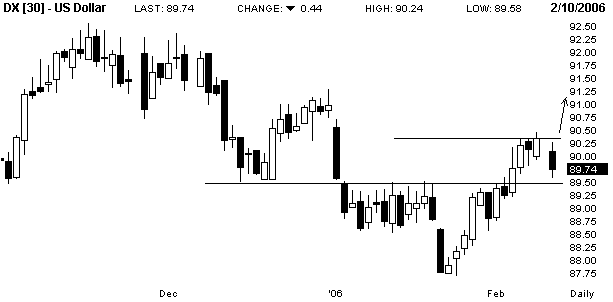
Recommended longs from 88.00. Added on a
sustained move above 89.50. Look to add more above 90.50.
Gold:
Critical support is now at $540 that must be broken to provoke more selling
pressure. As we said two weeks ago: Aggressive traders may look to short on a
break of trendline support at $565.
No change: We have said for weeks now that “Gold
looks like it is topping right now and should be headed sharply lower. Sentiment
measures are at levels that preceded previous sharp declines. So with gold very
overextended and ripe for a correction we think that an expected top in gold
should line up well with a strong rally in USD for 2006.” Gold’s steep selloff
is indicative of a market that needs a healthy correction. While doing so, we
should see a steady rise in the US dollar.
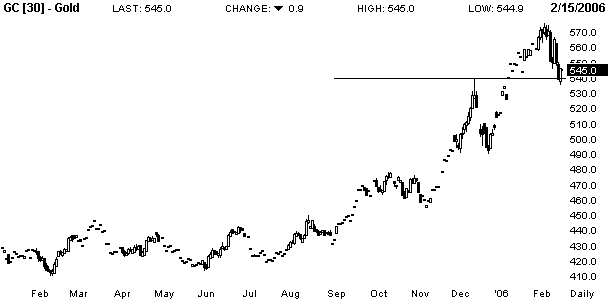
We have recommended option protection for weeks
for those that are long. We also said shorting on a break of trendline support
at $565 was a good trade for aggressive traders. We don’t like selling gold but
traders that are short from the break below $565 should place stops at cost or
just above the $574 highs.
Stocks: This
move again looks only like an ABC type correction which means those who are
short must be very careful as a move above downtrend resistance at 1283 could
ignite another move to MARGINAL new highs just above the 1,300 level.
We have been saying for weeks that we must see a
“five wave” decline from the 1,300 highs take us below the key 1,245 level. So
if the market is supposed to top then we HAVE to fall below 1,245 to get the
downside moving. Otherwise the trend remains in favor of the bulls. This is why
we have said for two weeks that “We still think traders can look to go short
with risk limited to 1,300. But a more pragmatic approach is to wait for a
completed “five wave” move below 1245 to confirm a top.”
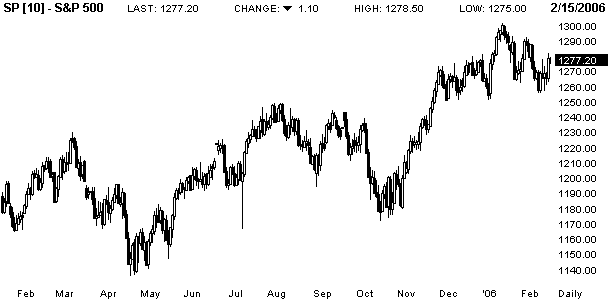
Go short with risk above 1,300. Add to position
on a move below 1245.
Bonds: No
change: Notes are still testing key support. A sustained move below here could
really see an increase in selling pressure considering that the speculators are
heavily net long. We have recommended shorts from 109 and noted that breaking
key resistance at 4.5%-4.7% could really ignite some selling considering that
the market is bearish on bonds but positioned the highest net long in 3 years.
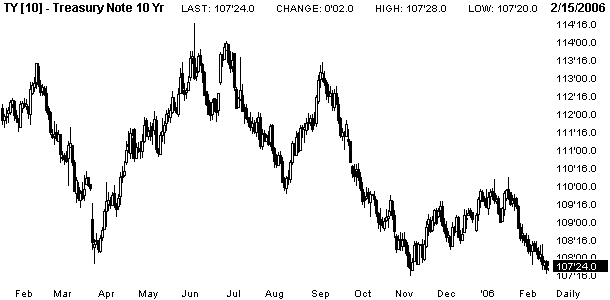
Recommended shorts from 109. Stops should be
placed just above 109.15.
Crude Oil:
The decline from $69 has been a straight shot and is now testing trendline
support. If we break here it would likely see a test of the $55 level which
would still probably be “wave C” of an ongoing sideways “ABCDE” triangle
pattern. Only a sustained move below $56 would indicate that this was an “ABC”
type correction and still then oil would be a good buy around $55 where we last
recommended to go long.
***** Something very bullish is also brewing in
NATURAL GAS. We don’t cover this market but the clear “five wave” move down to
extremely oversold levels with extreme bearish sentiment is the typical setup
for a rip roaring rally. Those who are looking to go long this market should
right now as it completes “wave 5” right on trendline support. This is a
VOLATILE contract so be prepared for a wild ride.
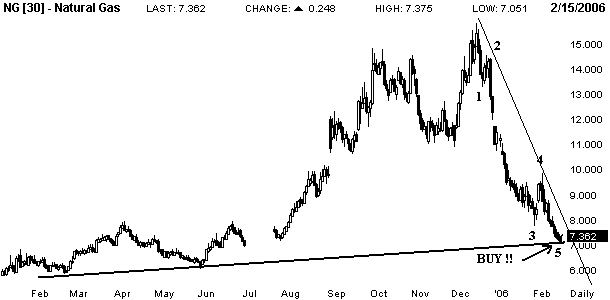
Back to oil:
Either way we have not changed our view that the pullback from the “wave 3” peak
at $70 would see some sort of “wave 4” correction followed by a sustained move
to $80-$100. The only uncertainty is how we were to get there. Therefore, we see
an opportunity for those that are bullish to buy in the $60 area over the coming
days to weeks.
Note that another possible interpretation is that
the move from the November lows counts as a “five wave” move higher with a
failed “fifth wave” at $69. Since we did not clear the August highs, this should
just be “wave 1” of a larger “five wave” move from the November lows. Both
interpretations are valid but we prefer the ABCDE correction as this would help
set up a large rally to our cited target.
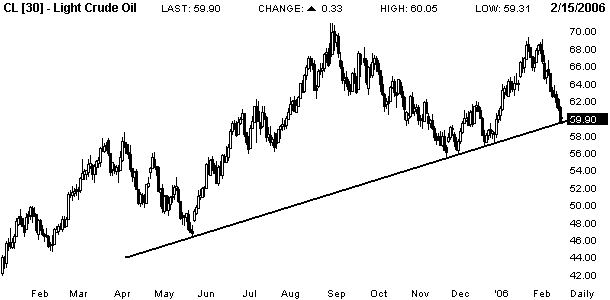
Recommended long at $55 last November. Still
looking for a move to $80-$100 over the coming months.
Regards,
Jes Black
FX Money Trends
613 4th St Suite 505
Hoboken, NJ 07030
Tel: 646.229.5401
Jes
Black is the fund manager at Black Flag Capital Partners and Chairman of
the firm’s Investment Committee, which oversees research, investment and
trading strategies. You can find out more about Jes at
BlackFlagForex.com.
Prior
to organizing the hedge fund he was hired by MG Financial Group to help
run their flagship news and analysis department,
Forexnews.com. After four
years as a senior currency strategist he went on to found
FxMoneyTrends.com – a research firm catering to professional traders. Jes
Black’s opinions are often featured in the Wall Street Journal, Barrons,
Financial Times and Reuters. He has also written numerous strategy pieces
for Futures magazine and regularly attends industry conferences to speak
about the currency markets.
