With The market Getting Short-Term Oversold , Here’s The Focus
What Thursday’s Action Tells
You
The SPX
(
$SPX.X |
Quote |
Chart |
News |
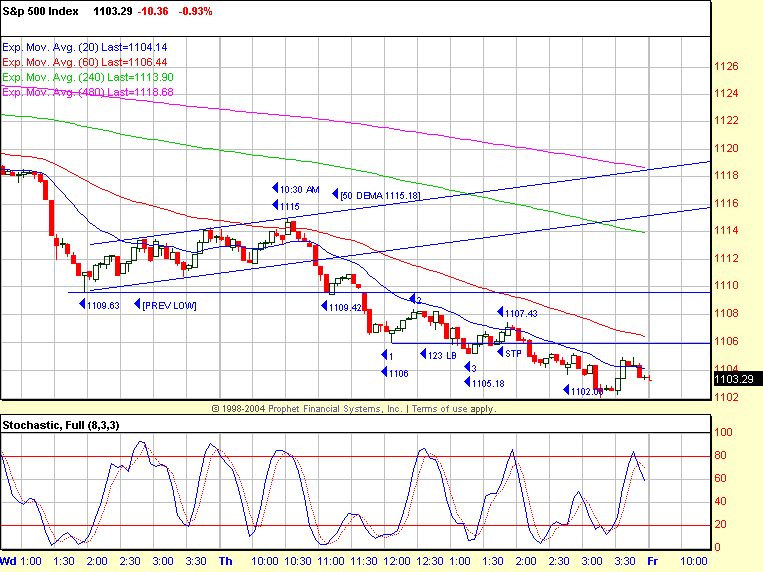
PowerRating) traded up to 1115 on
the
10:30 a.m. ET bar with the 50-day EMA at 1115.18, then reversed to a trend
down
day. Price accelerated below the 89-day EMA at 1112.95 and hit an intraday
low
of 1102.06, closing at 1103.29, -0.9%. The previous minor support became
yesterday’s resistance.
The Dow
(
$INDU |
Quote |
Chart |
News |
PowerRating) led the major indices
down
and was -1.1% to 9894. The Nasdaq
(
$COMPQ |
Quote |
Chart |
News |
PowerRating), 1903, declined -0.9%, but
the
(
QQQ |
Quote |
Chart |
News |
PowerRating) acted the best at -0.5% to 35.44, despite the
(
SMH |
Quote |
Chart |
News |
PowerRating), which led
the
primary sectors down at -3.2%. After three days down and -5.4%, the
(
OIH |
Quote |
Chart |
News |
PowerRating)
was +1.6%. The XBD closed at 124.56, -1.9%, and below its 200-day EMA of
125.42
and 233-day EMA of 124.71. The brokerage stocks always give you a good
picture
of the condition of the market.
NYSE volume was 1.43 billion shares with the
volume ratio 30 and breadth -590. The 5 RSI is now down to 21.
For Active
Traders
I have included the SPX five-minute chart
which
highlights the break below minor support, bouncing down from the 50-day EMA
and
below the 1112.95 89-day EMA. If you got short and followed price down with
your
stops above the previous swing point high, then you caught all of the move.
If
you covered on the 1,2,3 Lower Bottom entry above 1106, then you still had
a
great trade. If you took the 1,2,3 Lower Bottom long entry above 1106,
which
only ran to 1107.43, then you scratched, so not all bad.
Today’s
Action
With yesterday’s SPX intraday low at 1102.06
and
the previous 09/28 swing point low at 1101.29, price is entering a key price
zone in front of a key time zone later this month. The 200-day EMA went out
at
1100.72, the 233-day EMA at 1095.35 and the 12-month EMA at 1096.17. The
(
SPY |
Quote |
Chart |
News |
PowerRating) closed at 110.64 with the 200-day EMA at 110.53, 233-day EMA at
110
and the 12-month EMA at 110.04.
The QQQs have acted better than the other
major
indices, closing at 35.45, with the three primary long-term EMAs between
35 –
34.80. Minor support is the 35.15 level.
With the market getting short-term oversold
and
approaching key levels in price and time, our focus will swing to any price
action indicating a reversal. If the expectation is the SPX zone of three
long-term moving averages, then reality might be a downside overshoot of
that
zone, then a reversal. The Dow is trading below its long-term EMAs, while
the
QQQ remains above.
As of 7:45 a.m., there is no emotion in the
futures which are small green, but we are ready to react to any movement
after
the opening.
Have a good trading day,
Kevin Haggerty
Spend the next year trading with me.Â
Click here for details.

