3 Steps to Successfully Trade These Choppy Forex Markets
With daily ATR’s falling on average 15% across most of the majors and the crosses, along with several inside days, the price action chop fest has begun as the markets digest the Himalayan sell-offs, we have witnessed over the last few months.
This was intimated by how the intraday Ichimoku Clouds have gotten very finicky, like college students on triple espressos waiting to take their final exams.
Click here to order your copy of The VXX Trend Following Strategy today and be one of the very first traders to utilize these unique strategies. This guidebook will make you a better, more powerful trader.
Taking a look at the chart below, we can see how the Clouds or ‘Kumo’ have started the flipping contrast. Notice how the white portion of the cloud goes from top to bottom to top Mexican jumping bean style all over the charts for the last several days.
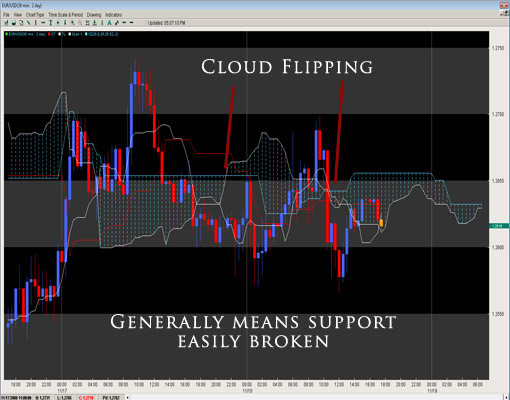
Remember according to Ichimoku theory, the cloud represents support and resistance levels. The thicker the cloud, the thicker the support/resistance it should offer. If its constantly flipping from thick to thin, then that basically is communicating an opportunity is right around the corner for the pair to reverse instead of continuing on in any particular direction.
Thus, if you are looking to catch any substantial move, the floor might drop right out from under you at any moment. This requires a more nimble trading approach as the flipping of the cloud results from the price action being direction less or zombie like bouncing from pillar to post looking for fresh meat. When I see this kind of chart formation, I generally result to the following tactical methods:
1) Drill down to smaller time frames (i.e. 1 or 5 minute charts) *we only suggest doing this if you’ve had practice/success at these levels and are choosing pairs with smaller spreads.
2) Super-size the time frames up to the larger parameters, aka the 4-hour or daily charts. This will create a pseudo-smoothing method and help one to see the larger ranges in play and play for rejections off the Bollinger Bands or 20EMA’s with correlating flat Momentum readings (12 period.)
3) The last option is to stay out which has been my more enjoyable method besides the 1min time frames. Sometimes, there just are not too many ladies for me to dance with on the dance floor. When that happens, I usually re-evaluate whether I am in the right environment or or whether I want to dance at all. I do Tango dancing so if there are no ladies around, then I’m generally not dancing. There will always be another Tango Milonga to go to and there will always be another trade in the markets.
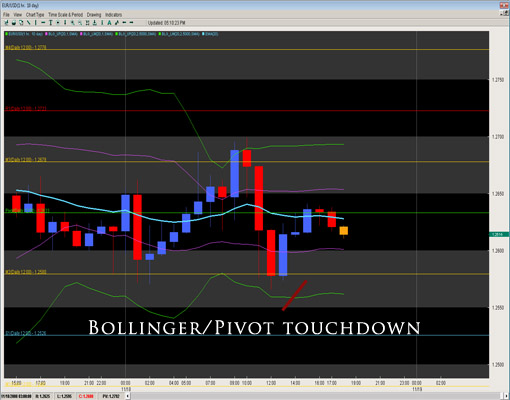
Remember the markets have a close relative called Las Vegas, and you want to make sure you are not always playing hands just because you have time and money to play. In the same fashion, you want to pick your games, tables and times to play where you are most likely to succeed. Based upon the current price action, this trader suggests smaller targets, trading pairs with tighter spreads, perhaps using Bollinger Bands and pivots if you are looking for a rejection play, and being more selective.
The chart below gives an example of such plays using the Bollinger Bands on the 1hr charts.
Chris Capre is the Founder of Second Skies LLC which specializes in Trading Systems, Private Mentoring and Advisory services. He has worked for one of the largest retail brokers in the FX market (FXCM) and is now the Fund Manager for White Knight Investments (www.whiteknightfxi.com/index.html). For more information about his services or his company, visit www.2ndskies.com.
Backtested on over 17,000 trades test this new trading indicator for Leveraged ETFs and find high probability setups daily – click here now.