• ConnorsRSI
    • Learn More About ConnorsRSI
    • Recent Articles
  • Store
    • Books
    • Free First Chapters
    • Free Newsletters
  • PowerRatings
    • Buy the PowerRatings Algorithm
    • Recent Articles

TradingMarkets.com

Quantified Stock Market Trading Strategies & Systems

  • Home
  • Latest Newsletters
  • Articles
    • Connors Research
    • ETFs
    • Options
    • Stocks
    • Volatility
    • Contributors
      • Larry Connors
      • Kevin Haggerty
      • Matt Radtke
  • Education
    • Trading Lessons
    • Connors Research
    • Glossary
      • Moving Averages
      • Options (Options Trading)
      • VIX
    • Interview Archive
    • Videos
  • Guidebooks
  • Courses
  • Store
  • April 22, 2018

High Probability ETF Trading: 7 ETFs You Need to Know for Thursday (AGG, TIP, DBB, EWT, EWS, XHB, ITB)

December 2, 2010 by David Penn

Wednesday’s rally brought the vast majority of exchange-traded funds out of oversold territory and into neutral or even overbought territory above the 200-day moving average. Traders looking for oversold opportunities for Thursday likely will be limited to bond funds like the ^BND^.

Today we’ll look at some of the exchange-traded funds that have moved to the top of our most overbought list. These are ETFs that are increasingly likely to pull back over the next few days and should be watched carefully by traders looking for markets that may be moving lower.

Here are 7 ETFs You Need to Know for Thursday.

In addition to BND above, bond ETFs like the ^AGG^ and the ^TIP^ (below) are typical of the markets currently trading in oversold territory above the 200-day.
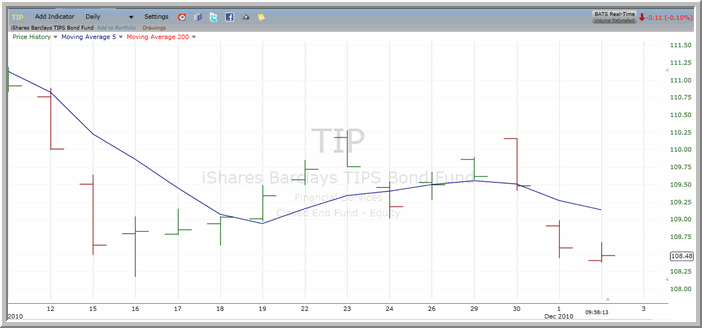
TIP chart

Shares of TIP were last at these oversold levels in mid-November, shortly before the ETF rallied to close higher for the next five consecutive trading days.

With 7 professional, quantified trading strategies for trading both bull and bear markets, High Probability ETF Trading by Larry Connors and Cesar Alvarez was voted one of the top 10 trading books of 2009 by SFO Magazine. Click here to find out why.

One of the biggest beneficiaries of Wednesday’s rally was the materials group. And as many materials stocks gained on the day, so did the ^DBB^ (below), gaining more than 3%.
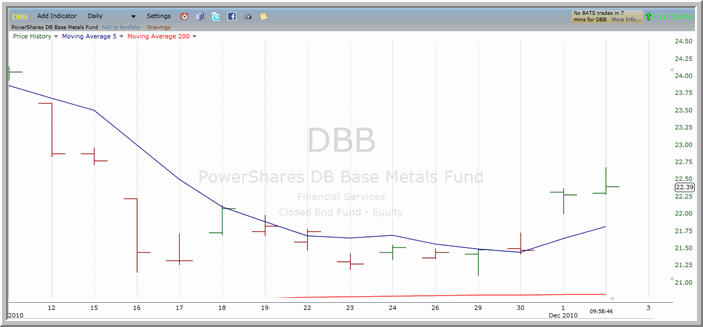
DBB chart

The DBB was last at these overbought levels late in the first half of November, just before the stock fell from more than $24 to near $21 over the balance of the month.

Among country funds, exchange-traded funds representing both Taiwan and Singapore are the most overbought. This means traders should be wary of scaling into both the ^EWT^ and the ^EWS^ (below) until they begin to pull back.
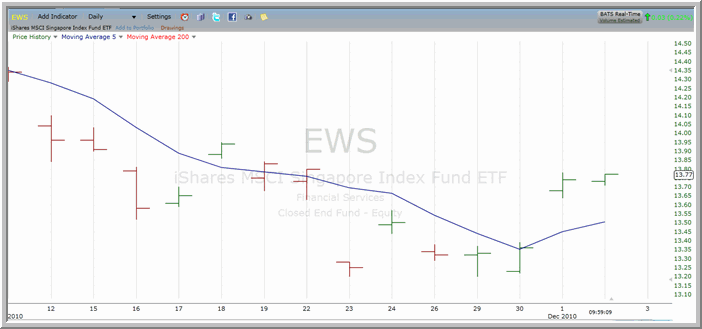
EWS chart

EWS is at its most overbought since early November and was trading in oversold territory as recently as last Friday.

Buyers continue to bid the ^XHB^ higher. The ETF closed higher for a second day in a row and crossed back above its 200-day moving average in trading on Wednesday.

Up three days in a row heading into trading on Thursday was the ^ITB^. ITB closed higher by well over 3% in Wednesday’s trading.

Why not give yourself the gift of data-driven trading this holiday season? Click here to learn how to Trade Like a Top Tier Professional using The New Machine Lite.

David Penn is Editor in Chief of TradingMarkets.com

Filed Under: Commentary, Recent, Short Term Trading Tagged With: 7 ETFs You Need to Know, High Probability ETF Trading, Moving Average - 200-Day, Overbought, Oversold, pull back, Short Term Trading, The Machine Lite

Have You Switched To ConnorsRSI?

ConnorsRSI is the first Quantified Momentum Indicator -- the next-generation improvement to traditional RSI indicators. At Connors Research, we are using it as an overlay to many of our best strategies to make them even better -- now you can, too.

Enter your email address to get your FREE download of our Introduction to ConnorsRSI - 2nd Edition - Trading Strategy Guidebook with newly updated historical results.


Recent Articles on TradingMarkets

  • Connors Research Trading Journal (Volume 1): Does Mean Reversion Still Work?
  • Yes, I’d Like to Attend the Free Webinar on Volatility Trading with Larry Connors on March 30, 2018
  • Current Market Symmetry
  • Kevin Haggerty’s Commentary for 10/13/17
  • PowerRatings as of 12/21/2009
  • Trader Discipline and Risk Management
  • Geometric Market Timing is the Significant Factor

Company Info

The Connors Group, Inc.
185 Hudson St., Suite 2500
Jersey City, NJ 07311
www.cg3.com

About Us

About
Careers
Contact Us
Testimonials
Link To Us

Company Resources

Help
Privacy Policy
Return Policy
Terms & Conditions

Properties

TradingMarkets
PowerRatings
Connors Research

Connect with TradingMarkets

  • Facebook
  • Google Plus
  • Linkedin
  • RSS
  • Twitter
  • Youtube
Google+

Subscribe

TradingMarkets Newsletters including the Connors Research Trading Journal

© Copyright 2018 The Connors Group, Inc.

Copyright © 2018 · News Pro Theme on Genesis Framework · WordPress · Log in

Disclaimer: The Connors Group, Inc. ("Company") is not an investment advisory service, nor a registered investment advisor or broker-dealer and does not purport to tell or suggest which securities or currencies customers should buy or sell for themselves. The analysts and employees or affiliates of Company may hold positions in the stocks, currencies or industries discussed here. You understand and acknowledge that there is a very high degree of risk involved in trading securities and/or currencies. The Company, the authors, the publisher, and all affiliates of Company assume no responsibility or liability for your trading and investment results. Factual statements on the Company's website, or in its publications, are made as of the date stated and are subject to change without notice.
It should not be assumed that the methods, techniques, or indicators presented in these products will be profitable or that they will not result in losses. Past results of any individual trader or trading system published by Company are not indicative of future returns by that trader or system, and are not indicative of future returns which be realized by you. In addition, the indicators, strategies, columns, articles and all other features of Company's products (collectively, the "Information") are provided for informational and educational purposes only and should not be construed as investment advice. Examples presented on Company's website are for educational purposes only. Such set-ups are not solicitations of any order to buy or sell. Accordingly, you should not rely solely on the Information in making any investment. Rather, you should use the Information only as a starting point for doing additional independent research in order to allow you to form your own opinion regarding investments. You should always check with your licensed financial advisor and tax advisor to determine the suitability of any investment.
HYPOTHETICAL OR SIMULATED PERFORMANCE RESULTS HAVE CERTAIN INHERENT LIMITATIONS. UNLIKE AN ACTUAL PERFORMANCE RECORD, SIMULATED RESULTS DO NOT REPRESENT ACTUAL TRADING AND MAY NOT BE IMPACTED BY BROKERAGE AND OTHER SLIPPAGE FEES. ALSO, SINCE THE TRADES HAVE NOT ACTUALLY BEEN EXECUTED, THE RESULTS MAY HAVE UNDER- OR OVER-COMPENSATED FOR THE IMPACT, IF ANY, OF CERTAIN MARKET FACTORS, SUCH AS LACK OF LIQUIDITY. SIMULATED TRADING PROGRAMS IN GENERAL ARE ALSO SUBJECT TO THE FACT THAT THEY ARE DESIGNED WITH THE BENEFIT OF HINDSIGHT. NO REPRESENTATION IS BEING MADE THAT ANY ACCOUNT WILL OR IS LIKELY TO ACHIEVE PROFITS OR LOSSES SIMILAR TO THOSE SHOWN.

All analyst commentary provided on TradingMarkets.com is provided for educational purposes only. The analysts and employees or affiliates of TradingMarkets.com may hold positions in the stocks or industries discussed here. This information is NOT a recommendation or solicitation to buy or sell any securities. Your use of this and all information contained on TradingMarkets.com is governed by the Terms and Conditions of Use. Please click the link to view those terms. Follow this link to read our Editorial Policy.

Return to top of page

Copyright © 2015   Developed by Memento Marketing;