High Probability Trading Report: Oversold Stocks and Overbought ETFs (AAPL, COF, NKE, SKF, TWM)
With equity markets still under strong selling pressure, the past of least resistance – as Larry Connors called it in his Daily Battle Plan Morning Market Intelligence report this morning – remains
to the downside.
As such, the task for high probability traders right now is to look for those markets that have become, or appear likely to become, overbought over the next few days. These are the markets that,
based on our research, have historically tended to reverse, making these markets potentially attractive candidates for short sales.
In the ETF world, these opportunities have not yet re-emerged. Some markets to keep an eye on include the ^SMN^, the ^SKF^, and the ^TWM^. All three of these ETF markets have entered overbought territory below the 200-day moving average and increasingly vulnerable to
reversal.
As far as high probability opportunities in stocks are concerned, there are three stocks from the S&P 100 that have pulled back into or near oversold territory above the 200-day moving average in recent days. Should these stocks remain above the 200-day moving average, they could represent a significant opportunity for high probability traders looking for bargains among blue chips.
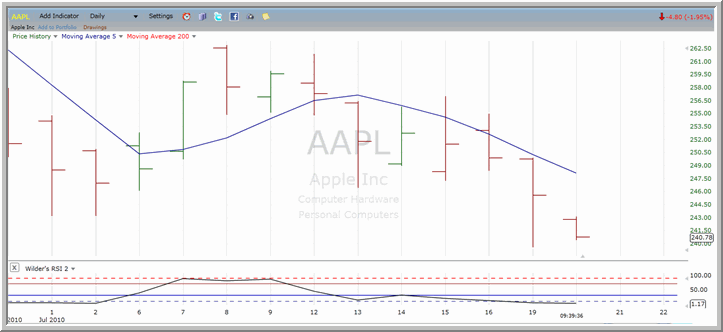
^AAPL^
Shares of Apple have closed lower for three days in a row, dropping below the 5-day moving average a week ago and continuing to trade below that level.

With a 2-period RSI of less than 5, Apple is among the more oversold stocks in the S&P 100. The last time the stock was this oversold above the 200-day was at the beginning of the month which it
rallied by more than 4% in three days.
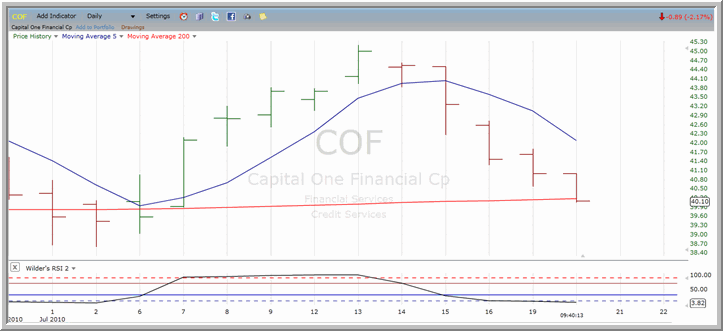
^COF^
Also increasingly oversold above the 200-day moving average are shares of Capital One Financial.

COF shares have plunged over the past three days in particular, dropping an additional 1% on Monday alone. This pullback has left COF exceptionally oversold and a potential buy-side target for
high probability traders on additional intraday weakness.
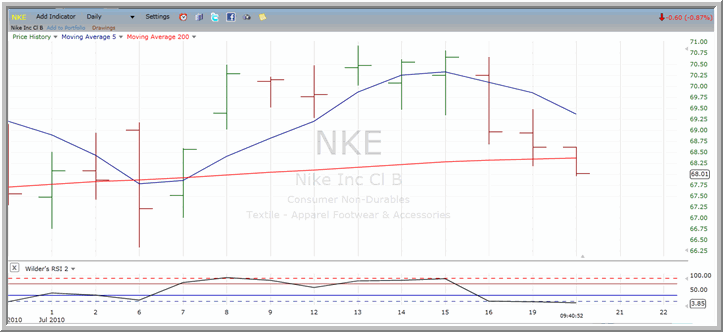
^NKE^
Two down days were enough to pull shares of Nike into oversold territory above the 200-day moving average on Monday.

Nike has been oscillating above and below the 200-day moving average since the beginning of the month, and the stock’s current pullback is largely the result of the stock’s last oversold bounce.
Only barely above the 200-day going into Tuesday’s trading, NKE may not be a first choice for high probability traders. But the retreating stock remains a tempting opportunity for traders as it
slides back toward oversold extremes.
With Larry Connors’ High Probability ETF Trading Software, short term traders have access to the same kind of “buy the selling, sell the buying” trading strategies that professional traders have used successfully for decades.
Click here to start your free trial to Larry Connors’ High Probability ETF Trading Software today!
David Penn is Editor in Chief at TradingMarkets.com.
