How to Day Trade With the Smart Money
We all study different patterns and setups, candlestick combinations and other particles of the Technical Analysis. However, there is one very easy to follow and pretty safe strategy that can be used in Day Trading. I call it “Follow the leader” strategy.
All stocks traded at NYSE are lead by a human being, called a specialist. Those guys normally work with one stock, rarely two if the stock has a low volatility. Besides their daily routine in connecting sellers and buyers, specialists also trade the stocks they work with as regular traders like you and me. The major difference between us is that specialist has all the information about the orders and their sizes for that particular stock, as well as the ability to move the stock price, while we do not see the same picture.
The understanding of what the specialist does, became a base for this strategy. So if you know what the specialist is doing, you can just mimic him and be a winner.
What the specialist is doing becomes visible on the “Tape”, where all of the trades printed out. That tape is a very important tool for us, as it has footprints of the specialist. Another valuable rule for us is that trades made by specialists have easily identifiable price. Look on the picture. Here are the specialist’s trades printed in white, and they have a noticeable price look, which has four decimals in it.
On the pictures below, the Tape is the black vertical field on a right with three columns. The first column is the price of the executed trade, the second column is the size of the executed trade and the third column is not interesting for us, as is just a routing of the trade, where it came from.
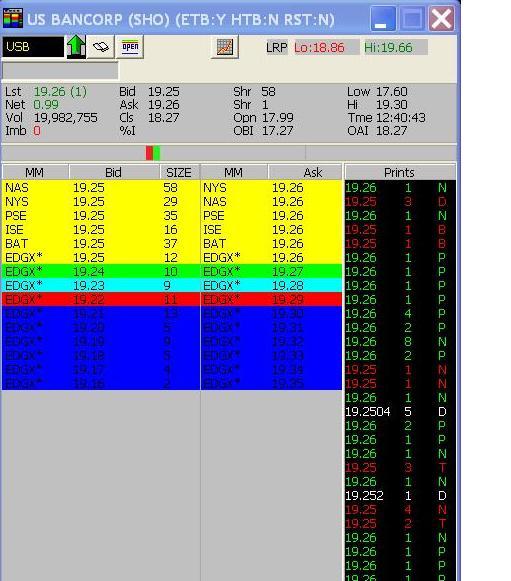
A specialist always buys and sells a stock all day long, scalping small lots of 100 to 1000 stocks, buying them and then selling them a couple of cents higher. But this morning I saw that the specialist of the USB stock started to accumulate a big position. He was printing on a Tape 19.0010, 19.0012, 19.0075, all around 19.00.
As we know the second column represents the number of shares purchased or sold on that particular transaction. 1 represents 100 shares, 2 represents 200 shares, 10 represents 1000 shares.
This morning I counted about 20 thousand shares that he bought in about half an hour around the $19.00. He was buying them in big lots, 1 to 6 thousand shares at once, which would look as 10 to 60 in the second column.
That gave me a signal to mimic the specialist and enter the trade at the same level with him, around $19.00. So I opened a long position.
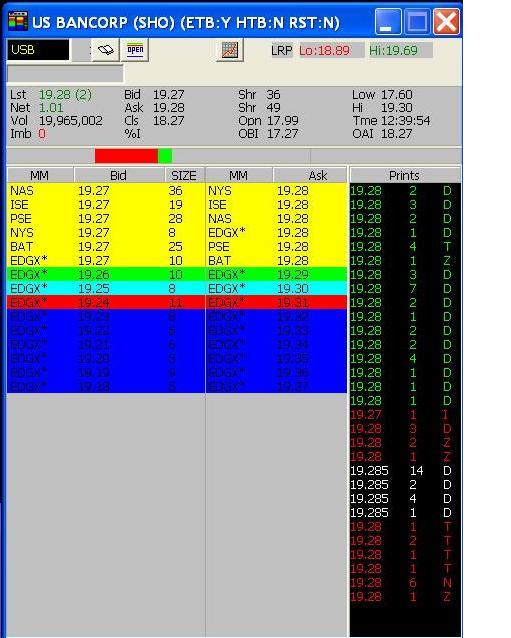
After he loaded up himself with stocks, he started to move the stock price higher. Now I see $19.02, $19.03, 19.04 printed on the tape. At $19.05 he started to close his position offering 100 shares. Then price moved to $19.10, he continued to sell his stocks in small lots 100 to 500 shares at ones. The price moved to $19.15, he continued to sell his stocks off in bigger lots now 1000 to 3000 shares. When I saw him selling out stocks in bigger lots that gave me a signal that we were approaching a local resistance level and the trade is loosing its steam. I left at $19.29 for a quick profit. At $19.33 the price stopped its upward move.
So finalizing the strategy, the way to identify if a specialist is buying or selling is to look at the price of his prints. When you see that a specialist prints out his trades at a price closer to Bid, then you can say he accumulates a Long position or is covering his Short position. When you see him printing out his trades at a price closer to Ask, then he closes his Long position or accumulates a Short position.
It might not be interesting to follow every of his trades, but when you see big size prints of 1000 or more shares at ones on a Tape, that should give you an alert to watch closely what the specialist is doing. There might be something big cooking.
By looking on these two pictures you can easily identify the trades of a specialist. First of all it is printed in white and second, his price has 4 decimals. On picture 1 he buys, as he prints his trades at a price that is very close to the Bid price, in our case $19.25. On picture 2 he sells shares, as his price is close to the Ask price, in our case $19.28.
So just Follow the Leader and cash your profit!
Roman Larionov is the founder of the Absolute Resolution Project, managed by the Absolute Resolution Consultants – New York based consulting company established in 2007. He has 12 years of experience including senior and executive management positions, project management, revenue management, sales, product development, people management and customer service. His trading experience includes 8 years of trading FOREX and NYSE equities.
Mr. Larionov holds two Bachelor’s Degrees in Management and Management of Crisis Situations along with the MBA degree in International Business.