How to Properly Trade a Range Bound Instrument, Part 2
In Part 1, Matthew Cherry details how traders can use the two statistics, frequency and range to help navigate sideways markets. To read part 1, click here.
In the second part of this article we will discuss the remaining two statistics, reaction time and strength, as well as start our initial development of a trading strategy.
Click here to order your copy of The VXX Trend Following Strategy today and be one of the very first traders to utilize these unique strategies. This guidebook will make you a better, more powerful trader.
Reaction time and strength are both measures of the price movement, however unlike the other statistics, these two measures are highly time sensitive. To calculate reaction time, you need to count the amount of bars that fall in to the range and divide it by the total frequency of each bound. To get the best representation of this measure you need to view the price action on a shorter time frame, one where you can break the price movement down to more precise time frames. If you do not break the chart in to more manageable time frames then you can get a very different figure that can lead to miscalculations in your trading.
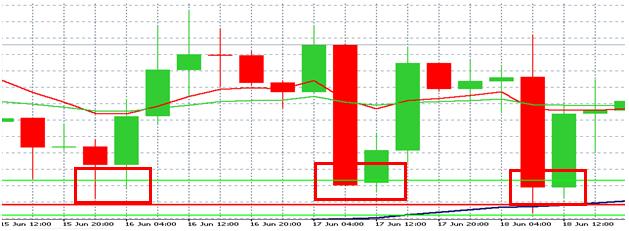
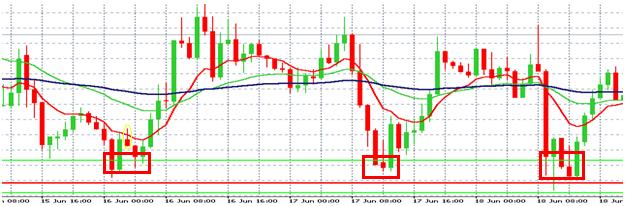
The above charts are a 4h chart and the corresponding 1h chart for the same time period. Using the two charts as an example we will calculate time reaction and get two very different figures.
For the 4 hour chart we see 3 separate instances where the price reacted to the range, each with 2 bars inside the range for a grand total of 6 bars. We divide this by the number of distinct instance (3) and get an average of 2 bars which represent a reaction time or 8 hours.
However if you use the 1 hour chart we get a much different answer. Here we see the same 3 instances, however there are more bars in range because each bar now represents 1 hour instead of 4.
After counting each instance we get the following results: 5 bars in the first range (4 if you exclude the outlier), 3 bars in the second and 5 bars in the third, a total of 13 bars. This gives an average reaction time of 4 and 1/3 bars which is the equivalent of 4 hours and 20 mins. This figure is nearly half the reaction time found using the 4 hour chart and highlights the importance of choosing the correct time frame to analyze.
It is important to note that you can use an even more specific time frame, such as a 15 min chart, however it is important not to over optimize this statistic as it more appropriately used as a gauge rather than an exact trigger.
The final statistic, strength, is one of the most important statistics you need to find as it plays a very important role in determining your overall trading strategy for this setup. Strength refers to the average price movement that occurs after a reaction to one of the bounds.
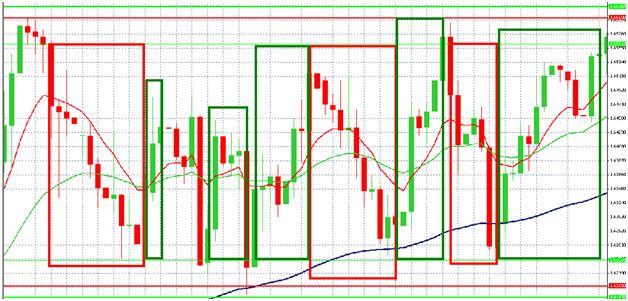
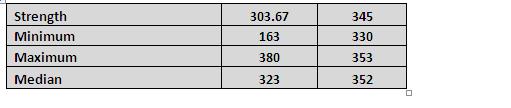
To calculate the strength, you should start by highlighting the reaction of each frequency, capturing the greatest distance the price moves after it has exited the range. This is can be done by finding the high or low point (depending on the which bound it reacts to) the price reaches after reacting to a bound, then measuring the total distance from this point to the inner range bound. Below is the summary of the measurements:
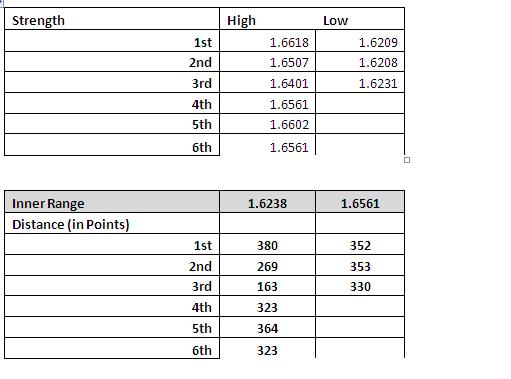
Once you have calculated the distances, you can find the strength by taking the average. Additionally you can find other useful statistics such as the max movement, the median movement etc.
Now that you have all four statistics, you can start to formulate your trading strategy. The first step to this process will be assessing whether the price is still exhibiting range bound characteristics. If the price is beginning to trade only towards one bound or has consolidated significantly it could be a signal of a breakout and additional risk management will be needed. However, if the price looks to continue to trade within the range, you can use the statistics you have calculated to develop a unique trading system that will provide better entry and exit points and maintain strict risk control. Several examples of how to create your own trading system based on these statistics will be shown in the next part of this series as well as an additional analysis and risk management lessons that can be used when trading this type of strategy.
Matthew Cherry is a market analyst for TradersChoiceFX.com. Many more of his latest articles can be found on the TradersChoiceFX Forex Blog. You can download a free Metatrader Practice Account from TradersChoiceFX and get instant access to a special report that will teach you how to use a Forex bonus program to improve your success as an FX trader.