How to Trade Reactions to News
Considering the nature of news announcements and their effects upon the markets, traders have often gravitated towards the events in the hopes of capturing a portion of the market response. Within FX, this phenomenon has drawn speculators interest to trading such events like a vulture to an about-to-be-corpse lying in a field below.
Because of the volatility and unique order flow surrounding such events, it is important to have specific methods when trading such events. We always recommend that if a trader is going to trade a news event, they pick the most significant of all economic events. Those would include:
1) Central Bank Announcements (FOMC, ECB, BOE, BOC)
2) NFP
3) Fed minutes Meeting
There are other economic events which move the market, but they have significantly less impact and probability to move the markets in such a stark fashion, thus we limit ourselves to the kings of the economic jungle.
The method we employ during such events is either a fade or breakout policy. For this article, we are going to focus on the breakout method, which is designed to give us an opportunity to take advantage of the announcement pushing the pair heavily in one direction due to the market’s response from the economic release.
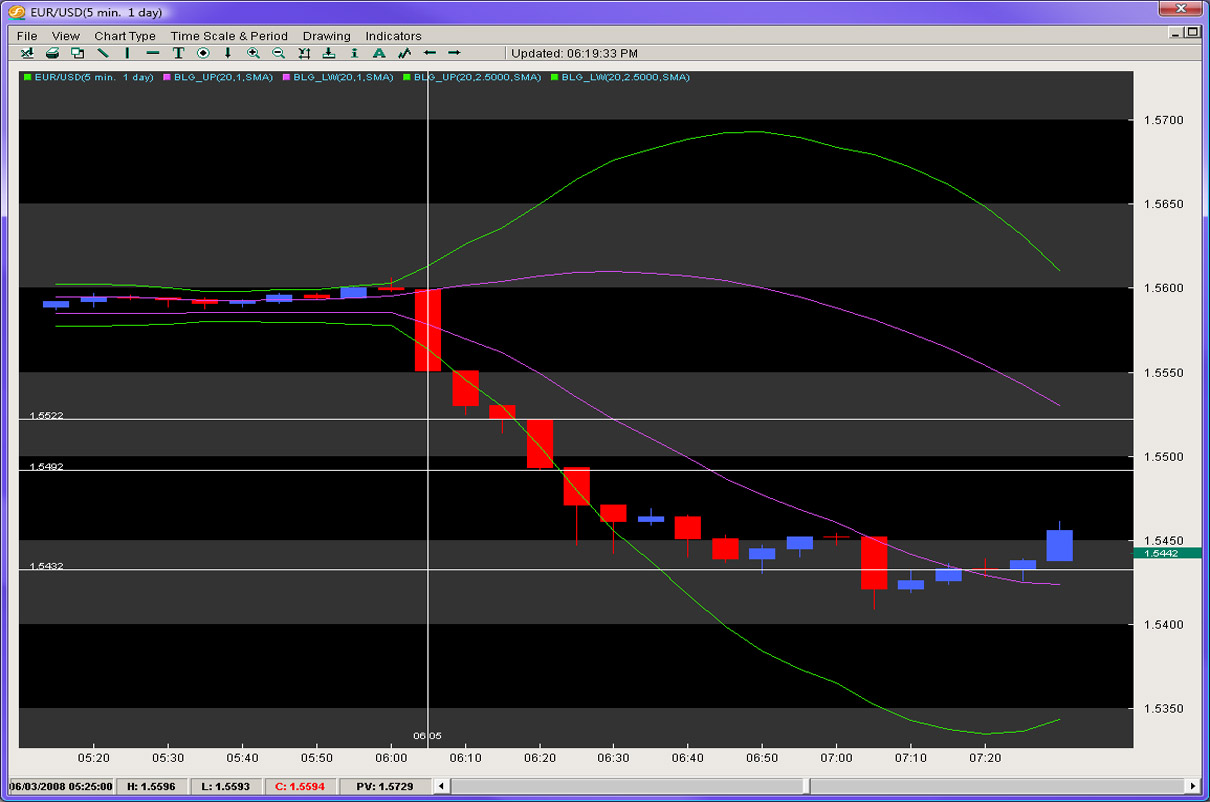
Figure 1 below is the EUR/USD on the 5 minute chart. We always will want to have the 5 minute chart up for this strategy. We will also want two sets of Bollinger Bands up, a 1) 2.5STD BB and 2) a 1STD BB. As you can see price gets real contracted leading up to the announcement and then the price action surges at the exact time the announcement is made.

The candle immediately pushes heavy in one direction and for the next three candles, makes lower lows. If the move after 15 minutes has made lower lows with each 5 minute candle, and the 2nd candle closes outside of the wick of the 1st candle, then we will trade in the direction of the move or breakout. Our entry is shown by the 1st horizontal line at 1.5522. Our first target will always be 30 pips and our initial stop will be 30 pips. We will enter in with two lots. After hitting our first target, we will bring the stop to break even or free. From here, this is where the Bollinger Bands come in.
We will use the space between the 1 and 2.5STD BB’s to act as a pocket or level of exclusion for order flow. If the BB’s are still pushing in the direction of the breakout and price is still contained within them, we will stay short. Our exit will be directed by the price action relating to the actual BB pocket and when you have either of the two conditions below:
1) any candle has 60% of the body in between the pair of 1STD BB’s (Purple lines) or 2) the entire candle exists inside or in between both 1STD BB’s, then we will exit the trade. In this case, we locked in 90 pips on the 2nd lot at 30 on the 1st for a total of 120 within 1 hour.
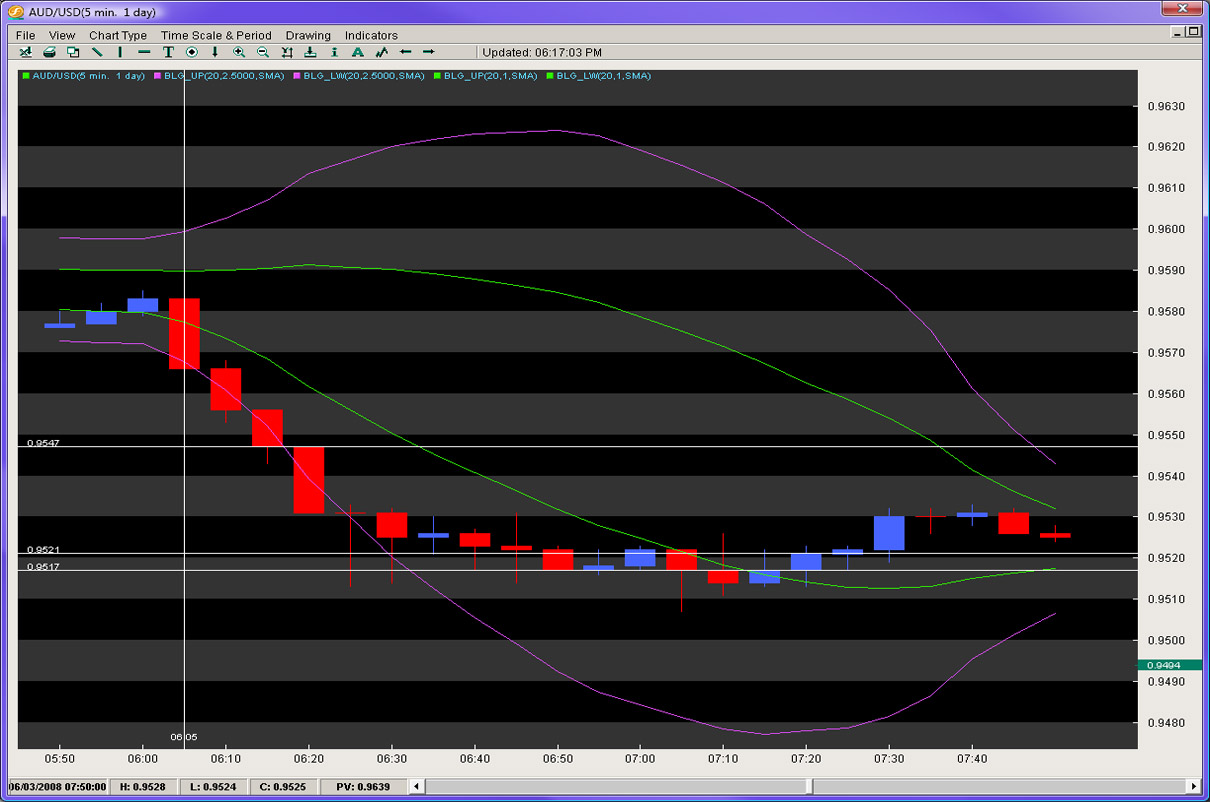
Figure 2 shows this same method with the AUD/USD on the 5 minute chart. you can see price well contained leading up to the announcement, then the candle breaking down heavily with the 2nd candle closing outside the 1st candle’s wick, and the third candle making a lower low. Thus the entry on the open of the next candle at 0.9547. our 30 pip target is achieved quickly and the 2nd target comes when the price action spills out into the space between the 1STD BB’s locking in another 26 pips totaling 56 pips in less than an hour.

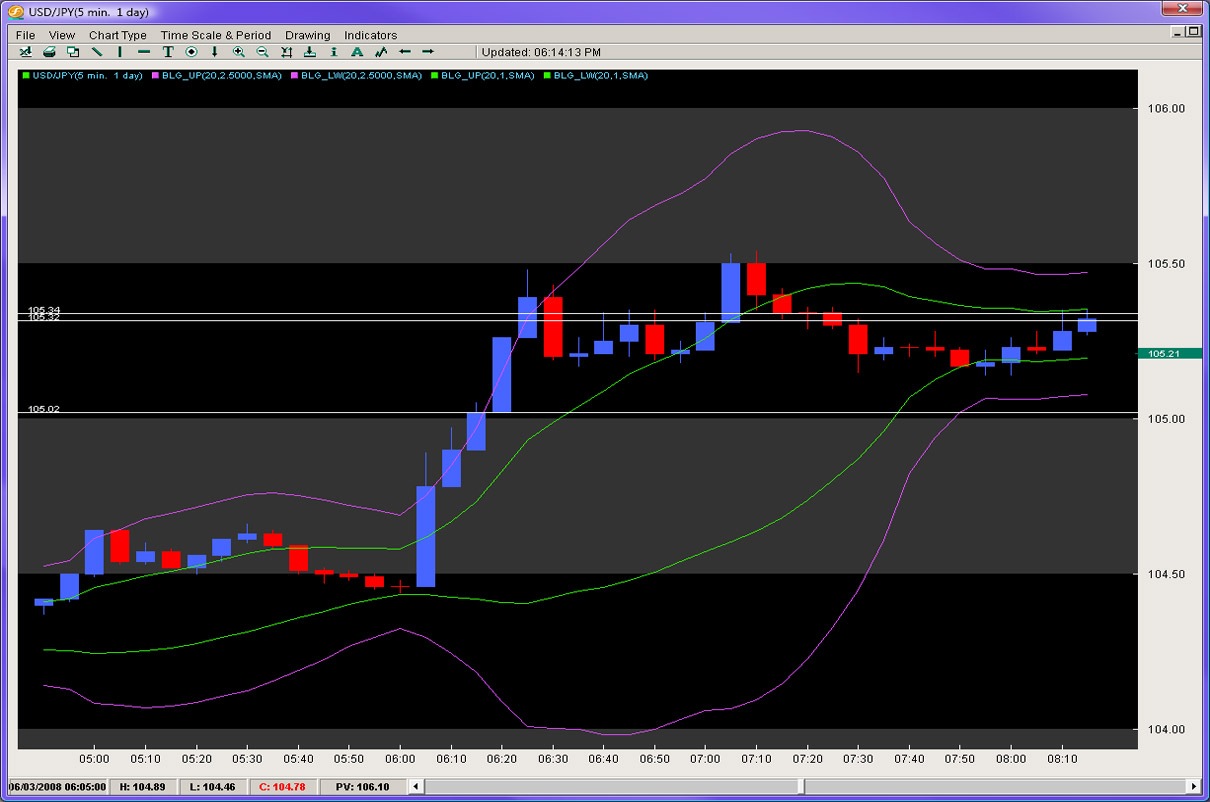
One last example is in chart 3 with the USD/JPY. As you can see below, the pair climbs really fast with the 2nd candle closing outside the 1st candle’s wick and the third candle making a higher high. Thus the entry at 105.02 and taking profit in 10 minutes and then the move fading about 45minutes later locking in another 32 pips for a 62 pip gain in one hour.

In conclusion, make sure to wait for 3 of the 5 minute candles to close and make sure the 2nd candle closes outside the 1st candles high/low depending in the direction of the breakout. Make sure to bring the stop to free after hitting the 1st target and watch for the move outside of the main pocket and into the space between the 1STD BB’s.
Chris Capre is the Founder of Second Skies LLC which specializes in Trading Systems, Private Mentoring and Advisory services. He has worked for one of the largest retail brokers in the FX market (FXCM) and is now the Fund Manager for White Knight Investments (www.whiteknightfxi.com/index.html). For more information about his services or his company, visit www.2ndskies.com.
Just released! Leveraged ETF PowerRatings ranks Leveraged ETFs on a high probability 1-10 ratings scale. Click here to get your free trial now.
