How to Use Candlesticks to Identify Support and Resistance
What Do Tails Tell Us?
What is a tail? It is a term used in candlestick charting to describe a long upper or lower shadow. Tails tell a story about the sentiment of market participants. But before delving into a discussion of tails and their implications, it is important to have a basic understanding of the construction of a candlestick chart.
Click here to learn how to utilize Bollinger Bands with a quantified, structured approach to increase your trading edges and secure greater gains with Trading with Bollinger Bands® – A Quantified Guide.
Candlestick Construction
A price bar’s range is the difference between the highest and lowest prices reached during a given trading period, for example, a daily trading session. The range is represented on a chart by a vertical line. The length of that vertical line shows visually how far the stock was run up, and down, during the trading period.
On a bar chart, the opening price of the session is shown as a short horizontal line drawn to the left of the vertical line. The closing price is drawn to the right. In candlestick charting, the area between the opening and closing prices is boxed (Figure 1.1). If price closes higher than it opens, the boxed area is hollow (white) indicating the session was bullish. If price closes lower than it opens, the boxed are is shaded (black) representing a bearish session.
Figure 1.1: Japanese Candlestick

The candlestick line is so called because it actually resembles a candle. (The term candlestick is often shortened to candle.) The boxed area of the candlestick line is referred to as the real body, or body (Figure 1.2). The thin vertical lines drawn above and below the real body are called the upper shadow and lower shadow, respectively. A shadow is sometimes called a wick because it looks like a wick that extends out either end of a candle. The shadows represent the price extremes (high and low) of the trading session.
Figure 1.2: Candlestick Line

Although the Japanese do put a lot of emphasis on the candlestick’s real body, the shadows can also tell us about the psychology of market participants. Therefore, shadows can play an important role in chart analysis. The following discussion specifically addresses the formation and implications of long shadows.
Long Shadows (Tails)
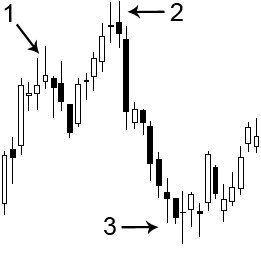
A long shadow may be referred to as a tail. When one or more long upper shadows form after a price advance, it is an indication that the market is reaching for a top, which is why they may sometimes be referred to as bearish shadows. Refer to 1 and 2 in Figure 1.3. When one or more long lower shadows form after a price decline, it signals the market is reaching for a bottom. Long lower shadows may be referred to as bullish shadows (refer to 3 in Figure 1.3).
Figure 1.3: Tails Formed After Directional Price Moves
What Do The Tails Tell Us?
Long upper shadows warn that there may not be enough demand at higher prices to continue to propel the stock upward, at least for the short term. Although the stock or index may have formed a higher high, it has closed well off that high. This is especially evident near an overhead resistance area, and/or when a stock or market is overbought. These tails suggest that bullish traders are taking profits on long positions and bearish traders may be initiating short positions.
Long lower shadows warn that lower prices are being rejected. Even though the stock or index may have formed a lower low, it closed well off that low. This may occur near an area of support on the chart, and/or when a stock or market is oversold. These tails suggest that bearish traders are taking profits on short positions (covering) and bullish traders are entering long positions.
It is important to understand how a long shadow is formed. For example, before a long lower shadow is evident, it is first a long bearish candle (1) as illustrated in Figure 1.4. The bears are clearly in control. Then the bulls start initiating long positions, and some short covering occurs, which puts upward pressure on price. As price starts to rise, a lower shadow begins to emerge (2). The buying by bulls, and covering of short positions by bears, causes price to move higher and higher revealing more of the lower shadow. By the end of the session, what was previously a long bearish candle (1) is now a long lower shadow (3). The strong rally that occurred off the low of the session will cause concern for many bearish traders. Eager bulls have arrived and put a damper on the downward move. More bulls may jump aboard in the following trading sessions generating a rally and, subsequently, more short covering by bears to add fuel to the rally.
Figure 1.4: Example of How a Tail May Form

Tails at Support and Resistance
The formation of one or more tails at, or near, an area of support (bullish shadows) or resistance (bearish shadows) is fairly common. Experienced traders pay close attention to visible barriers on a chart and often execute trades near those points. When a stock is rising and encounters resistance, many traders use that barrier as a target to exit long positions, or at least take partial profits. In addition, bearish traders may enter short positions near a resistance area in anticipation of a downside move. (Once a decline begins, it may be more difficult for them to borrow shares.) The reverse often occurs as support is tested.
The daily chart of Genesee & Wyoming Inc (GWR) in Figure 1.5 illustrates how tails may form at resistance and support areas. After putting in the October 2008 low, price rallied for a few weeks. Prior support often becomes new resistance when tested from the other side (and vice versa). Thus, as price approached the August and September 2008 lows (dotted line labeled “resistance”), two long upper shadows formed indicating profit-taking occurred on long positions. Additionally, some short positions were initiated by bears at that area because it provided a fairly low risk entry with plenty of downside potential.
During November, price declined back to the October low (dotted line labeled “support”). Two long lower shadows formed as the October low was tested. That price action was caused by the covering of short positions as bears utilized the support area as a target. Additionally, bullish traders were willing to initiate long positions at support because it provided a fairly low risk entry with plenty of upside potential.
Figure 1.5: Tails Formed at Resistance and Support Areas

Source: TeleChart 2007
In some cases, a long shadow may form and yet there does not appear to be any support or resistance impacting the price action. Just because prior support or resistance is not visible within the data displayed on the daily time frame does not mean it is not visible on a higher time frame. For example, a chart of Republic Airways (RJET) is shown in Figure 1.6 with the daily time frame on the left and the weekly time frame displayed to the right. A long lower shadow formed on February 20, 2009 on the daily chart. As you can see on the weekly chart, there was strong support at that area (dotted line).
Figure 1.6: A Tail Formed at Support That Was Visible on the Weekly Chart

Source: TeleChart 2007
Tails in Overextended Conditions
Price need not be near a visible support or resistance area for a tail to form. Price may simply have moved too far too quickly in one direction causing a short-term overbought (uptrend) or oversold (downtrend) condition.
Price often pulls back after a directional move. Thus, long shadows can serve as a warning for short-term traders to take profits. For example, on the daily chart of Dick’s Sporting Goods (DKS) in Figure 1.7, price rallied far above the 20-period simple moving average (SMA) in early December 2008. Note in the past when price moved away from the 20-period SMA, it had a tendency to pull back toward it. In addition, the Stochastic oscillator (12-3-3 setting) was in overbought territory above its 80 line. That signaled a short-term overextended condition, which is often followed by a pullback as short-term traders lock in profits from the prior move. The upper shadows (A and B) provided further evidence that the bulls were running out of steam. In this case, price was also testing resistance at the November 2008 high increasing the likelihood that price would change direction. In the days following the formation of the tails, price pulled back to the 20-period SMA.
Figure 1.7: Tails Formed When the Stock was Overbought

Source: TeleChart 2007
If you spend time learning the primary bearish and bullish candlestick reversal patterns (recommended), you’ll discover that some of those patterns include a tail. For example, a Shooting Star is a bearish pattern that forms after a price advance. It has a long upper shadow and a small real body that forms at the lower range of the candlestick line. The candle labeled B in Figure 1.7 is a Shooting Star. In fact, its body is so small some traders would identify it as a Doji. Candle B was followed by a strong bearish candle (C). By the close of bar C, price was already well off the swing high at the top of candle B. Thus, the upper shadows on candles A and B served as a warning that the short-term uptrend was likely to pull back or move sideways as short-term traders took profits.
Tails provide short-term signals. They indicate that a change in the direction of price may occur; however, they do not indicate how significant the change will be, or how long it will last. Still, these signals can be utilized by swing traders, and in some cases, by traders holding longer-term positions. For example, if price is coming up against a major ceiling, even long-term traders may choose to take some profits on a long position. Or they may use a bounce at support to initiate a new long-term position. For example, if a trader was looking to take a core position in GWR in Figure 1.5, the tails that formed at support also set up a potential double bottom, which is a larger bullish reversal pattern that is often strong enough to launch a new uptrend.
Tails may also form during times of increased volatility in a stock or market. Long upper and/or lower shadows are a sign of significant intraday movement up and down. For example, if you look at the August 2007 low on the daily chart of the Dow Jones Industrial Average you’ll see a very long lower shadow (a bullish hammer) formed ending a sharp correction. Another hammer formed on the Dow on January 22, 2008 followed by a second tail as that correction ended. Again at the October 10, 2008 low a long lower shadow formed on the Dow’s chart. It is important to pay attention to signals that occur on the charts of the major averages.
Conclusion
Long shadows reveal a loss of control by the previously dominant group. Recognizing such can help with chart analysis and trade management. Price often changes direction, at least temporarily, after the formation of one or more long shadows. Swing traders can use these signals to their advantage to exit a position and/or take a trade in the opposite direction. For example, if a swing trader held a long position in DKS in Figure 1.7 when the upper tails formed on December 5 and 8, 2008, he may have chosen to exit a long position. If a bearish trader noticed the long upper shadows forming at resistance on November 3-4, 2008 on the chart of GWR in Figure 1.5, she may have elected to initiate a short position while a bullish trader would have been exiting his position to capture the gains from the preceding uptrend.
Just remember that when you see a tail(s) form, you should be prepared for price to change direction. Price may reverse the direction of the trend, or at least consolidate for a period of time.
Tina Logan is an active trader, coach, trainer and speaker. She is known for her ability to break down technical trading concepts into easily digestible pieces. Tina is primarily a swing trader; however, she also takes day trades periodically as well as holding longer-term positions during favorable market conditions. She is the author of Getting Started in Candlestick Charting (John Wiley & Sons, Inc., 2008) and also contributed a chapter to Stephen Bigalow’s book High Profit Candlestick Patterns.