How to Use the COT Report
The majority of traders use a purely technical
approach using price indicators, which tend to disregard the fundamentals. While
this can be successful at times, it can also cause a trader to be completely
blind-sided by events in the market. The bottom line is it pays to know the
fundamentals. The fundamentals allow you to anticipate where the market is
heading rather than reacting to what has already occurred. Trading purely on
fundamental data only can be very dangerous. Fundamentalists calculate a value
for a specific commodity based on the laws of supply and demand. At some point,
the commodity may become cheap or expensive in relation to the supply and
demand. Unfortunately, the value of a commodity is not simply determined this
way. Its value is determined by what the market is willing to pay for it…now.
In the long run, the fundamentals will rule, but in the short run, anything is
possible and this is why we must be fully aware of both technical and
fundamental changes in the market.
I use the Commitment of Traders Data to determine what the fundamentals of the
market are. I believe that the Commercials who deal in the cash markets on a
daily basis know much more about the fundamentals than we do or anybody else for
that matter. They have the money and the motive to pay the salaries of weather
scientists, forecasters, research scientists & analysts from all over the world.
I use their expensive fundamental analysis at their cost, not mine. The core of
my system focuses on this information. I’ve found ways to analyze both past and
present COT reports to gain insight on the current condition of the market(s),
and what the commercials are anticipating in the near future. Remember, the
commercials are the most informed group of traders. They are the ones who
provide the supply & demand information to the USDA and other government
agencies, which in turn release this data to the public in the form of S&D
reports, crop reports and other reports in which the public tend to anticipate
and react to.
Among my most treasured and important proprietary indicators is the COT data. As
important and insightful as I have found this data to be, there are limitations
to its use and even more importantly, there are proper and improper ways for a
trader to be acting on this data. It is very important to recognize and
understand the limitations of any indicator or data when it comes to financial
decisions, and regarding the COT it is absolutely crucial the data is
interpreted properly and incorporated into a complete trading system that also
incorporates traditional forms of technical analysis. My own position trading
approach includes statistical indicators derived from the COT combined with
unique price patterns, price structures, and price derived indicators based on
traditional technical analysis.
The IMPA (in-depth commitment of traders analysis) is my core longer-term
position trading system. The IMPA stands for “Individual Market Participant
Analysis”.
The IMPA Position Trading System is composed of two key components:
1. Fundamental analysis
2. Technical analysis
Fundamental analysis is used to select the markets that have a unique underlying
fundamental condition that is either bullish or bearish. Not all of the markets
will have the right fundamental conditions. Most of the time, the markets are
trading in a range and are in-balance. In other words, there are no imbalances
in supply and demand or any fundamental conditions that may cause a shift in
either supply or demand. Our system tracks the supply and demand balance by
breaking down the open interest (open positions) by individual participant and
then tracking each participant’s behavior (IMPA).
There are three participants in futures:
1. Public
2. Funds
3. Commercial hedgers
The COT data allows us to track the activity of the individual market
participants. We record and measure the sum of their trading (longs, shorts and
delta) on a week-to-week basis. Using a proprietary statistical formula we
developed, we are able to determine when the dominant market participants
(commercial institutions) are building statistically significant positions. They
(commercial institutions) represent the largest single component in the futures
market. They (commercial institutions) generally accumulate (scale into) large
positions over a period of time (weeks to months). We track their behavior and
study the many relationships between their actions and the behavior of the
market as a whole.
The IMPA system identifies the markets that are most likely (high probability)
of breaking out to the upside or downside and trending significantly. We do not
care if the commercials are long or short, or by how much. They can actually be
net-short and bullish as they have been in silver several times in the past. We
also are not that concerned with how much their positions change from week to
week. We do care about the size of their net-position however and how that
relates to their normal size position.
Below is an example of how my IMPA position trading system works:
This is for a Hog trade that we took in July of 2005.
Lets review the charts and see where the price was during July 6th and July
13th. This graph shows where the price was with the release of the COT data.
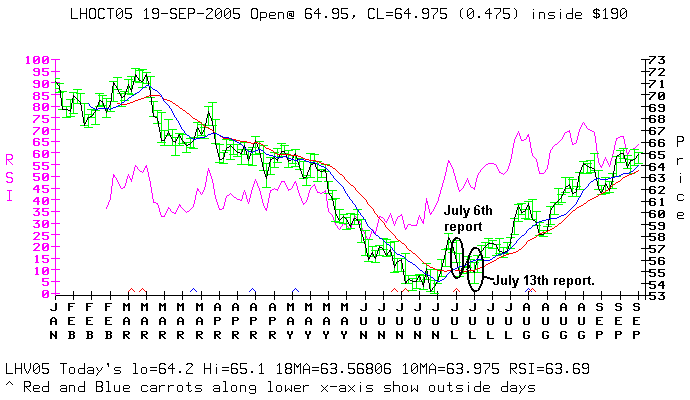
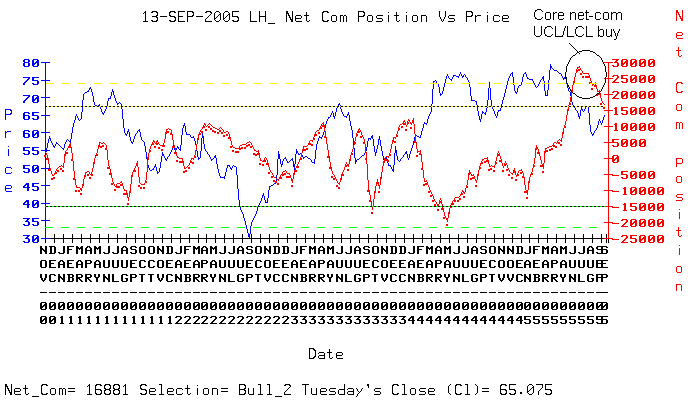
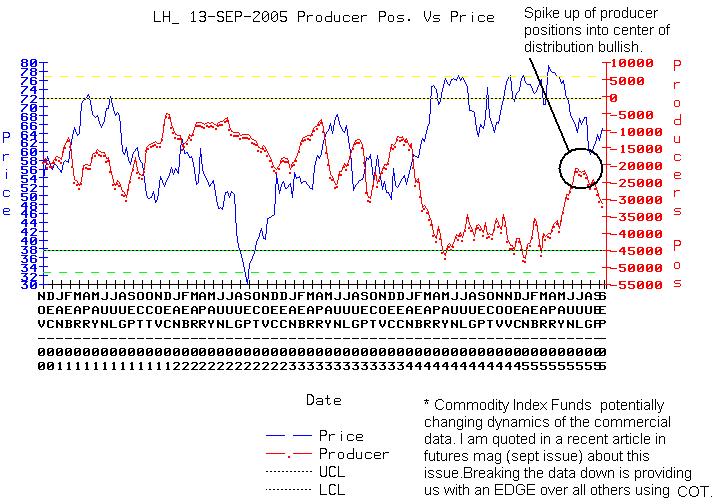
Now lets review the commercial participants and other participants in detail!
This graph shows us that the net commercial position is bullish. It is above our
UCL line. The UCL line is an indicator that shows us that the commercials hold
excessive positions in the market.
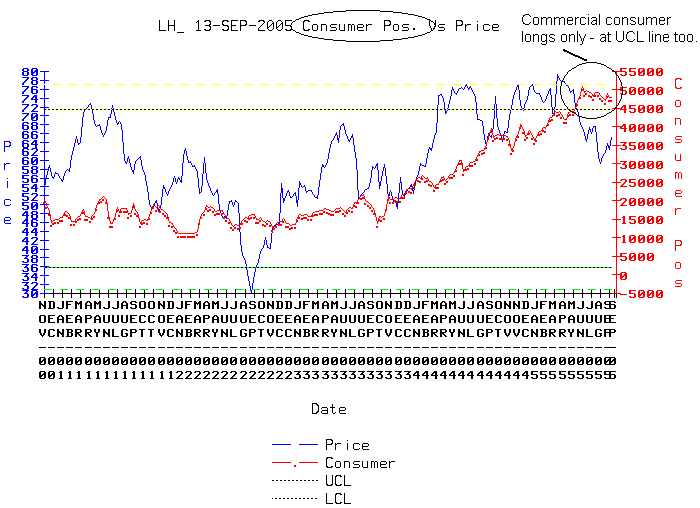
This graph shows our commercial consumer position. The consumers are the ones
who want the product, in this case hogs. They are excessively bullish on this
graph, above the UCL line, which again is one of our indicators.
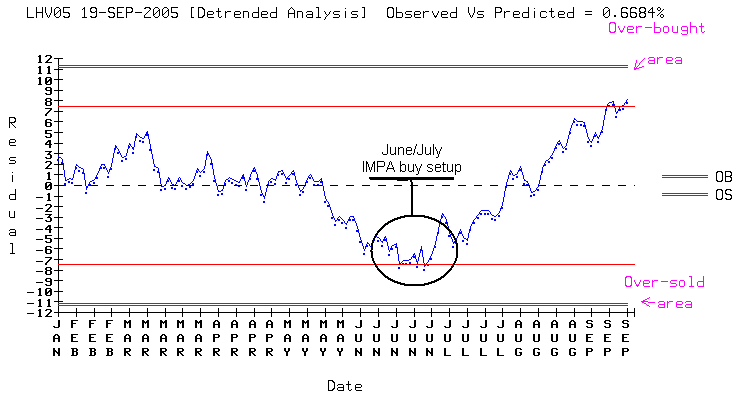
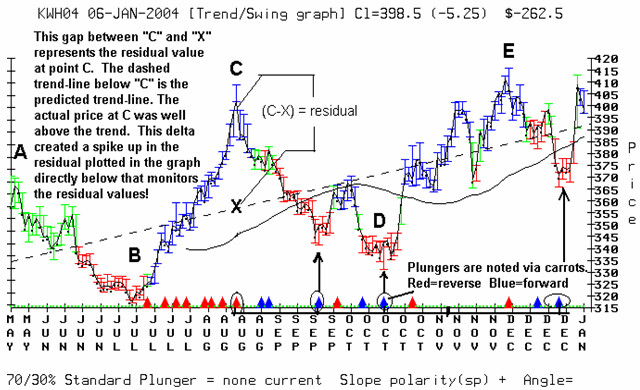
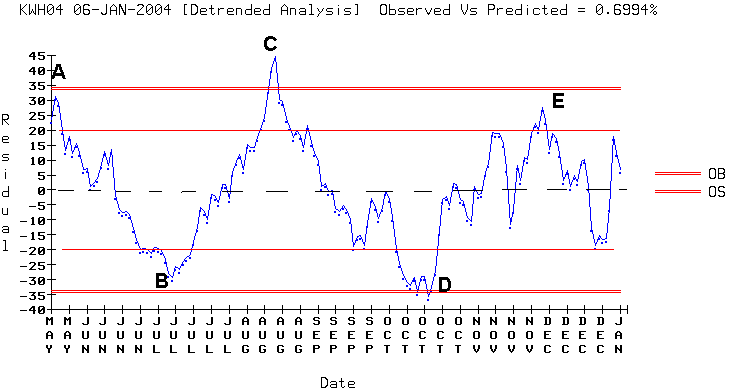
This is our detrended analysis. The graph basically looks at the degree of
deviation from a moving mean. The residual data from the daily trend/swing
color-coded graph (below) is used with this graph. These two graphs should be
used together. I have added a complete explanation of both graphs to the end of
this document.
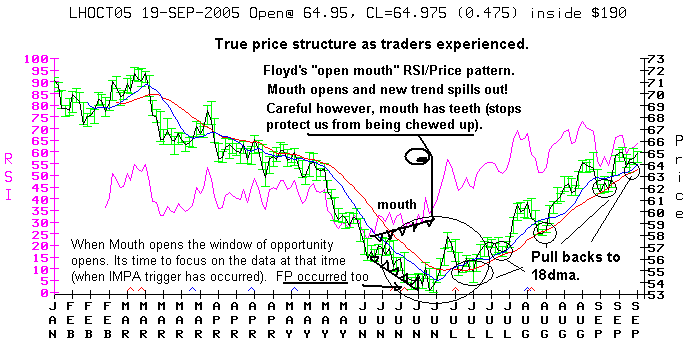
This is the daily trend/swing price graph. An illustration on how to interpret
this graph is below.
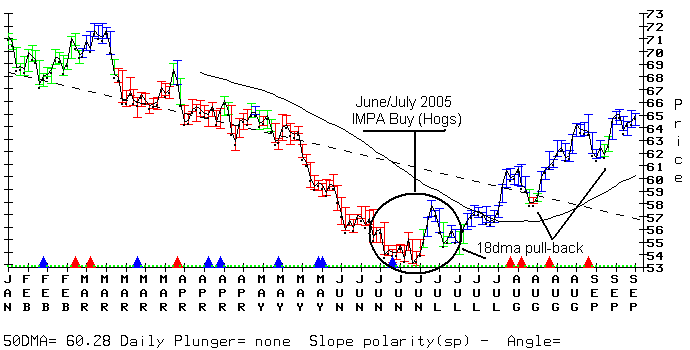
The following graphs give an illustration on how these two graphs work (they
should be used together). The explanation is pretty self-explanatory.
This graph illustrates the working relationship between the daily trend/swing
color-coded price graph and the detrended (residual) analysis. It is an
illustration for using the daily Trend/Swing color-coded price graph with the
daily detrended analysis (an over-sold / over-bought measurement).
More notes below:
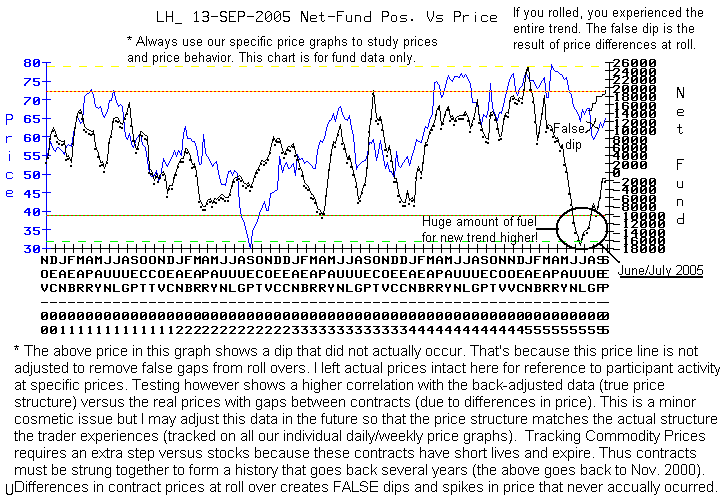
Funds provide the FUEL for the new trend to begin in June/July 2005.
* Some spikes and dips in the price line on the net-com UCL/LCL graphs reflect
differences (gaps) in price from contract to contract during rollover. Back
adjusting of price to remove gaps is not necessary in these graphs because the
indicator lines are derived from the COT data only and not from price. The price
is provided for reference only. Removing the gaps via backward adjusting does
increase the price/net-com correlation coefficient, but also sacrifices actual
contract prices. This can be advantageous however since a higher correlation
coefficient reinforces the validity of the indicators and thus increases
confidence.
Since futures contracts have relatively short lives, building histories requires
stringing several contracts together. When differences in price exist from
contract to contract, the difference can show up in a trading indicator or in
back testing. This often results in confusion. However, in order to have an
accurate true technical representation of what a trader would experience it is
necessary to backward adjust the data to remove the false gaps (dips and
spikes). There is a downside to this however. The downside is that old prices
will not always accurately reflect the actual prices that occurred in history.
HOWEVER, this is cosmetic only because the structure is what is most important
and the structure is fully intact.
Here is an example: Our daily price graph is backward adjusted to remove the
false gaps caused by contract rollover. This adjustment is necessary to preserve
actual price structure in the way a trader would experience it. If for example
you bought hogs at 56, and sold at 58 while rolling into the next month at 68,
this would mean you locked in a profit of 2 full points at the time you rolled
(58 minus 56) and then you are long again at 68. The fact that you exited at 58
and entered the next month at 68, a full 10-point increase has absolutely no
baring on your trade or the trend. All that happened is that the price from one
contract to the next was substantially higher. A trader does not benefit or
suffer from this. Thus if you exited at 70 after buying on the roll at 68, your
profit here would be 2 full points as well. If a person however did not take
into consideration the difference in the contract prices, it might appear that a
trader who entered at 56 and then rolled and finally exited his position at 70
had a much larger profit than what actually occurred (in reality). Some system
developers will not adjust to remove the gaps and their testing as a result is
not as accurate.
* Fund positions are un-liquidated contracts. When extreme this provides fuel
for a trend reversal and/or new price trend. Notice the positive correlation
with price trend. Hence funds are the smart trading money.
Floyd Upperman is
recognized as the foremost analyst of Commitment of Traders (COT) data. Floyd
studied mathematics, statistics, and computer programming in college and has a
degree in electrical engineering. He became interested in commodities in the
early 90’s and used his statistical knowledge and programming abilities to
develop a revolutionary approach to identifying price trend changes and
large-profit opportunities. Floyd recently published his first book, “Commitment
of Traders: Strategies For Tracking The Markets And Trading Profitably”
(John Wiley and Sons, December 2005).
If you would like to learn more about the IMPA trading system, and how Floyd follows the Commitments of Traders
data, his website is www.upperman.com.