If a Stock Drops 5 Days in a Row, Should You Buy It?
What happens to stocks that close up, or down,
consecutive days? Most people would say stocks that close up consecutive days
are strong, and stocks that close down consecutive days are weak. This type of
thinking makes perfect sense. After all, it feels good when a stock you own keeps going
up, and bad when a stock you own keeps going down. Therefore it’s only natural
to think strong stocks go up and weak stocks go down — therefore you should buy
strong stocks and sell weak stocks.
However, our research shows there is an edge in
stocks that have declined three or more consecutive days.
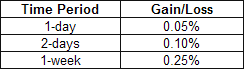
Consecutive Up/Down Days
We looked at over seven million trades from 1/1/95 to
6/30/06*. The table below shows the average percentage gain/loss for all stocks
during our test period over a 1-day, 2-day, and 1-week (5-days) period. These
numbers represent the benchmark which we use for comparisons.
We then looked at stocks that made exactly three
consecutive up/down closes, all the way to stocks that made exactly seven
consecutive up/down closes. Here’s what we found:
Consecutive Up Days
-
Stocks that closed up exactly three consecutive
days, on average,underperformed the benchmark 1-week later (+0.14%).
-
Stocks that closed up exactly four consecutive
days, on average,underperformed the benchmark 1-week later (+0.02%).
-
Stocks that closed up exactly five consecutive
days, on average,showed negative returns 1-week later (-0.11%).
-
Stocks that closed up exactly six consecutive
days, on average,showed negative returns 1-week later (-0.30%).
-
Stocks that closed up exactly seven consecutive
days, on average,showed negative returns 1-week later (-0.40%).
As you can see, the statistics show even greater
underperformance each step of the way.
This research shows that traders should avoid
buying stocks that make consecutive up days and aggressive traders may
consider short selling these stocks.
Consecutive Down Days
-
Stocks that closed down exactly three consecutive
days, on average,outperformed the benchmark 1-week later (+0.36%).
-
Stocks that closed down exactly four consecutive
days, on average,outperformed the benchmark 1-week later (+0.54%).
-
Stocks that closed down exactly five consecutive
days, on average,outperformed the benchmark 1-week later (+0.63%).
-
Stocks that closed down exactly six consecutive
days, on average,outperformed the benchmark 1-week later (+0.82%).
-
Stocks that closed down exactly seven consecutive
days, on average,outperformed the benchmark 1-week later (+1.06%).
In this case, the statistics show even greater
out-performance each step of the way.
This research shows that traders should look
to build strategies around stocks that make consecutive down days.
Our research shows there is an edge in buying stocks
that have declined three or more consecutive days. It also shows this edge
increases when we extend the sequence to five, six, and seven consecutive days.
Conversely, our research shows stocks that have risen three or more consecutive
days should be avoided. Short sellers should consider taking a closer look at
stocks that have risen five or more consecutive days.
Once again we find statistical evidence that
shows short-term strength is usually followed by short-term weakness and
short-term weakness is usually followed by short-term strength.
Just like the other articles in this series (view
archives), these returns can be improved even further by adding simple
conditions, like filtering stocks based on whether they are trading above or
below the 200-day moving average (see below),
days of the month, and/or combining them with
PowerRatings,
etc.
How to use this information every day
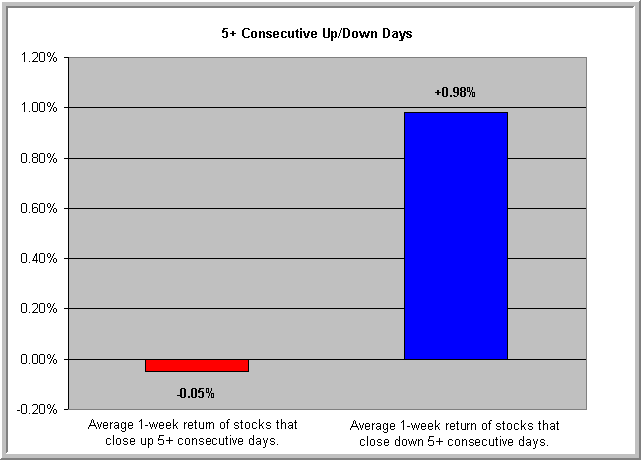
TradingMarkets just launched a new set of stock
indicators designed to help you implement our research into your daily trading.
One of the new indicators lists stocks that make 5+ Consecutive Up Days that are
trading below their 200-day MA (bearish), and stocks that make 5+ Consecutive
Down Days that are trading above their 200-day MA (bullish). The graph above
shows the returns of these stocks. For a free trial for a subscription to
TradingMarkets and access to the new indicators,
click here.
Please send me any questions or comments you may have regarding
this article.
Ashton Dorkins is
Editor-in-Chief of TradingMarkets.com
Larry Connors is CEO and Founder of TradingMarkets.com,
and Connors Research.
* Our research looked at 7,050,517 trades from Jan
1, 1995 to June 30, 2006. We applied a price and liquidity filter that required all stocks be
priced above $5 and have a 100-day moving average of volume greater than
250,000 shares.