Market reversal or just a bounce? This tool can tell you
Stocks bounced higher for the third
consecutive session last Friday, as trading activity slowed ahead of
the holiday weekend. The S&P 500
(
SPX |
Quote |
Chart |
News |
PowerRating), Nasdaq Composite
(
COMP |
Quote |
Chart |
News |
PowerRating), Dow
Jones Industrial Average
(
DJX |
Quote |
Chart |
News |
PowerRating), S&P Midcap 400, and small-cap Russell 2000
indices each gained 0.6%. Each of the major indices also finished near their
intraday highs, although the Nasdaq was relatively choppy. Overall, last week’s
one percent bounce in the S&P 500 was a welcome relief for the bulls, but the
index still remains 2.3% lower for the month. With two days remaining in May,
the Nasdaq is down 4.8% in the same time period.
As anticipated, turnover declined significantly in last
Friday’s session. Traders cutting out early for the Memorial Day holiday
contributed to total volume in both the NYSE and Nasdaq coming in 23% below
their respective levels of the prior day. It was the lightest volume day for
both exchanges in more than five weeks. The broad market registered solid price
gains between last Thursday and Friday’s sessions, but the problem is that total
volume levels fell off substantially both days. Preceding Friday’s 23% decline
in volume was 24% lighter volume in both exchanges the previous day. As such,
the stock market’s gains of the past two days certainly have not been confirmed
by higher volume. While higher volume is not always necessary in order to
signify a market bottom, there generally needs to be an overall pattern of
accumulation either when the rally starts or immediately preceding it. So far,
the only accumulation we have seen was the higher volume gains of the May 24
reversal day. Conversely, a vast majority of the market’s down days in recent
weeks have been on higher volume, which signifies institutional distribution.
Did last week’s retracement in the broad market represent a
bottom or was it merely a technical bounce within the context of the downtrend
that began earlier this month? One tool that is useful for answering this
question in situations such as this is the use of
Fibonacci retracements. Simply put, the three major Fibonacci retracement
levels we follow are 38.2%, 50%, and 61.8%. In a downtrend, the less an index or
stock retraces, the more likely it is to head back down and continue its
downtrend (the opposite is true in uptrends). A market that is steadily trending
lower will commonly retrace up to 38.2% or even 50% of its last downward move
before resuming the current trend and setting new lows. However, if a
downtrending market retraces more than 61.8% of the last move, that is often a
warning sign that a bottom may have formed and the trend is about to reverse.
Conversely, markets that are VERY weak may not even bounce up to the 38.2%
retracement level. Since stocks have rallied off their lows for the past several
days, let’s take a look at where both the S&P 500 and Nasdaq-100 indices stand
in relation to their Fibonacci retracement levels. We’ll begin by looking at the
S&P 500 SPDR
(
SPY |
Quote |
Chart |
News |
PowerRating), which mirrors the benchmark S&P 500 Index:

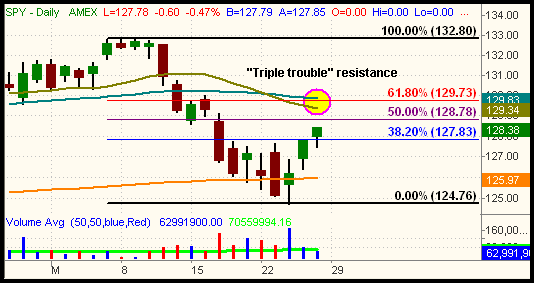
The most notable technical event in SPY is that it tested and
bounced off support of its 200-day moving average last week. However, despite
three straight days of gains, SPY has only recovered a little more than 38.2% of
the slide from its May 5 high down to its May 24 low. The 61.8% retracement
level, often a reversal point in short-term trends, lies between resistance of
the 20 and 50-day moving averages. Not only is the 61.8% retracement level a
major area of resistance, but both the 20 and 50-day MAs have now become major
resistance levels as well. Given the lack of power behind the broad market’s
rally over the past few days, it seems unlikely that SPY will rally up to its
61.8% retracement level on this move before the bears step back in. Even if it
does, there is now additional overhead supply created by the break of the 20 and
50-day MAs. Therefore, the daily chart points to decent odds that SPY will at
least re-test last week’s low before it sees its 50-day moving average again.
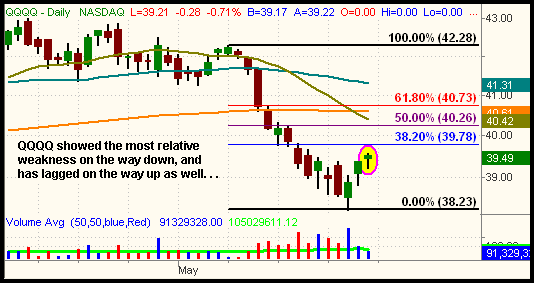
Next, take a look at the daily chart of the Nasdaq-100 Tracking Stock (QQQQ):

As you probably noticed very quickly, last week’s retracement
in QQQQ lagged the recovery in SPY. When measured from its most recent peak on
May 8 down to its May 24 low, QQQQ has not yet even rallied up to its 38.2%
retracement level and remains well below its 20, 50, and even 200-day moving
averages. While this is obviously bearish, it is not surprising considering that
QQQQ also showed more relative weakness than SPY by losing a greater percentage
on the way down. In fact, notice that QQQQ formed its top a full month before
SPY. When SPY broke out to a new high on May 5, QQQQ merely formed a “lower
high.” You may recall our analysis at that time in which we suggested that the
relative weakness in the Nasdaq would eventually drag down the S&P and Dow as
well.
When the broad market is choppy and stuck in a trading range
for a lengthy period of time, we tend to focus our analysis on specific industry
sector ETFs that are showing the most relative strength or weakness to the
broad-based indices. Such is the reason why a vast majority of our daily
technical analysis focused on individual sectors, rather than the broad market,
throughout March and April of this year. However, when the major indices are
trending steadily in either direction, we find it makes sense to trade the
broad-based ETFs such as SPY or QQQQ instead. In a steady uptrend, relatively
easy profits can be realized through buying each price retracement down to a
major Fibonacci support level and subsequently selling into strength a week or
two later. Conversely, we have had an equal amount of success over the years
through selling short the broad-based ETFs on rallies into Fibonacci resistance
levels. Presently, we remain short the Dow Jones DIAMONDS (DIA) and regular
subscribers will see our specific trigger price for adding shares to that
position in the event of a resumption of the downtrend.
On a different concluding note, we want to make you aware of a
new ETF that was launched on the American Stock Exchange last week — the
Market Vectors Gold Miners ETF, which trades under the ticker symbol GDX.
Unlike the GLD or IAU exchange traded funds, both of which mirror the price of
the spot gold commodity, GDX follows the price of the Amex Gold Mining Index, a
composite of 43 individual gold mining stocks. Because the price of the
commodity itself is often out of sync with the performance of the mining stocks,
the new Gold Miners ETF provides a way to easily participate in the mining index
without the need to determine which are the best performing stocks in such a
volatile sector. GDX has been added to the
Morpheus ETF
Roundup report and will be included in the next revision that is
automatically e-mailed to subscribers.
Open ETF positions:
Short DIA (regular subscribers to
The Wagner Daily
receive detailed stop and target prices on open positions and detailed setup
information on new ETF trade entry prices. Intraday e-mail alerts are also sent
as needed.)
Deron Wagner is the head trader of Morpheus Capital Hedge Fund and founder of
Morpheus Trading Group (morpheustrading.com),
which he launched in 2001. Wagner appears on his best-selling video, Sector
Trading Strategies (Marketplace Books, June 2002), and is co-author of both The
Long-Term Day Trader (Career Press, April 2000) and The After-Hours Trader
(McGraw Hill, August 2000). Past television appearances include CNBC, ABC, and
Yahoo! FinanceVision. He is also a frequent guest speaker at various trading and
financial conferences around the world. For a free trial to the full version of
The Wagner Daily or to learn about Deron’s other services, visit
morpheustrading.com or send an e-mail to
deron@morpheustrading.com .
Â
