Market Timing is Easier with Candlestick Signals
Millions of investors lost huge percentages in the market over the past eighteen months. Why? Because most money managers were working off of an outdated premise of buying a good strong company and holding it for the long-term, and expecting it to do well. Unfortunately, they disregarded one of the basics truths of price movement in the markets. Prices do not move based upon fundamentals – Prices move based upon the perception of fundamentals.
Over a year ago, analysts were recommending stocks such as U.S. Steel Corporation at $180 a share because it was a fundamentally strong company. Such fundamental analysis does very little for an investor when the price falls to $20 a share. Candlestick analysis provides a very clear indication of what investor sentiment is doing in the markets.
If you are looking to trade one of the most powerful pullbacks strategies available to traders today, order our newly updated guidebook –The Long Pullbacks Strategy – by clicking here today.
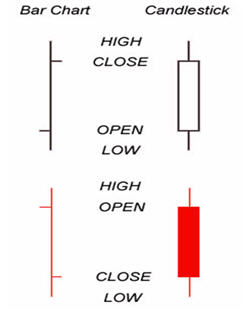
Japanese rice traders used the same information found on a standard bar chart. The difference is that they put more weight on the open and closing prices as well as the high and the low of a time period. As illustrated in Figure 1, an open that is lower than the closing price creates a white candle. An open that is higher than the close creates a black candle. The positioning of these candles, with analysis of the colors of the candle, provides valuable information.
The one overriding factor built into Japanese candlesticks signals is that they are formed by the cumulative knowledge of all the investor input, the buying and selling, of a trading entity during a certain time period. Candlestick analysis allows investors to project market reversals with a relatively high degree of accuracy. This can be done when utilizing the 12 major candlestick signals. One misconception about candlesticks signals is that there are too many of them to learn. In reality, of the 50 candlestick signals, only about 12 signals appear a majority of the time. The Doji, the Bullish and Bearish Engulfing signal, the Hanging Man, Shooting Star, Hammer, the Bullish and Bearish Harami, the Dark Cloud, the Piercing pattern, the Morning Star and Evening Star signals and the Kicker signal. Although they may not sound sophisticated, the Japanese rice traders named these signals to make them easy to recognize as well as to understand. Knowing these signals will dramatically improve your analysis of trend reversals and movements.
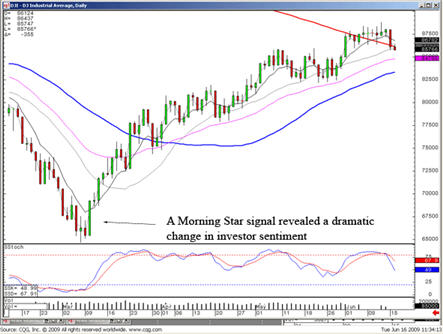
No matter what you hear about possible changes in market direction, candlestick signals tell you exactly what investor sentiment is doing. That was clearly illustrated by analyzing what the Dow and the NASDAQ were telling us in early March of 2009. In Figure 2, there was a clear Candlestick Morning Star Signal that illustrated investor sentiment about the market.
Japanese Candlestick signals incorporate an extensive amount of information not found in other trading methodologies. Hundreds of years of observations allowed Japanese rice traders to successfully identify reversal patterns, because they could visually see the investor sentiment that formed the signals. This knowledge creates a very accurate tool for projecting the next move in price. It is easy for all investors to learn; both novice and professionals alike can quickly learn and benefit from these signals. Moreover, this allows an investor to sift through all the market noise, and rhetoric from the so-called professionals. When candlestick signals demonstrated a consistent uptrend, numerous money managers professed it was merely a bounce in a downtrend. They are going to wait until the next pullback. While they may still be waiting to enter the market, there have been opportunities, using candlestick signals, to extract profits of over 100% in specific sectors.
Identifying long established, statistically proven reversal patterns, as well as knowing how they were produced, provides a very powerful investment tool. Buy low, sell high. Amazingly simple! Yet the spikes in volume, in most trading entities, appear when panic selling occurs at the bottom, and when exuberant buying produced blow-off tops. This should lead to a simple question. Who was buying when everybody could not sell fast enough and who was selling when investors were running prices through the roof? Fortunately, these questions have been asked for centuries. Visual observations recognize the existence of fear and greed. Japanese rice traders recognized reoccurring patterns that depicted the reversals in trends, utilizing the price movements preceding a major trend reversal.
A candlestick signal formation has one major aspect that makes it more powerful than all other technical analysis. The signal is the result of the change in investor sentiment. This statement will be repeated for effect. The signal is the result of the change in investor sentiment. Not the anticipation of a possible change! The actual result is the change of trend direction. Having this as an investment tool can dramatically change an investors ability to maximize profits while reducing risk exposure. It allows the average man or woman investor to invest with the same temperament as the professional trader.
Buy at the bottom, sell at the top. Pretty easy, right? Yet where does one grab the falling knife? When is high too high? Candlestick signals alleviate that problem. A candlestick ‘buy’ signal, appearing after an extensive decline in a stock price reveal compelling information. (All trading entities can be effectively analyzed with candlesticks. The term “stock” will represent all trading entities.). This information inherently benefits investors, making for comfortable trading decisions.
The basic function of investing is to make money. However, few investors develop a trading program that put the probabilities in their favor. If searching for the “Golden Goose” of investment programs, the criteria would be simple; well researched, proven track record, and easy-to-identify reversal points.
All three of these elements are incorporated into Candlestick signals. Hundred of years of rice trading resulted in the identification high probability profitable trades. Make one assumption. The signals would not be around today if it were not for one convincing result. PROFITS! Candlestick signals exist today because of hundred of years of actual profitable trades. Not computer back testing. Not questionable results. Profits produced from utilizing the signals are the only reason we are witnessing these signals today. Reversal signals were identified by rice traders using very simple charting techniques. You can take advantage of these clear profitable signals?
As in any investment program, the underlying motive is to find characteristics that place the probabilities greatly in the investors favor. Logic implies that when you witness a Japanese candlestick “buy” signal in an oversold condition, you should have an extremely high probability that trade will be profitable. Oversold conditions can be defined as to when stochastics are in the area of 20 or below. Being able to add other conditions such as moving averages, Fibonacci numbers, trendlines and trading channels, to a Japanese candlesticks signal in oversold condition only enhances the probability of making a correct trade. Putting all these observations together provides a compelling platform for market timing strategies.
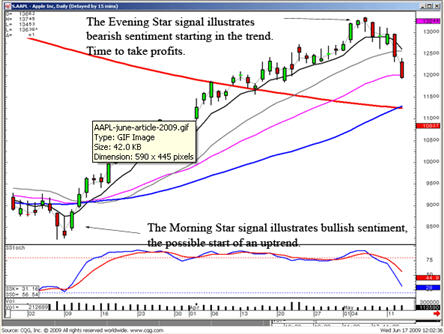
Candlestick signals are merely investor sentiment put into a graphic depiction. As illustrated in the Apple Inc. chart, the morning star signal produced evidence the uptrend was starting. The evening stars signal, with a hanging man signal incorporated into the signal, illustrated when it was time to take profits.
This is not rocket science. This is simple investment philosophy’s put into a visual graphic. The 400 years of actual investment results from Japanese rice traders have provided high probability signal results. The candlestick signals illustrate the investor sentiment, mostly defined as fear and greed. Human emotion, when it comes to investing funds, will always have the same ingredients. The candlestick signals are simply the graphic depiction of investor sentiment. Candlestick signals were not discovered and tested by computer back testing simulations. Candlestick signals are the result of centuries of analyzing how human emotions affect a price trend. The occurrence of the signals, over and over, at specific points in a trend-reversaI, provide a statistically proven trading platform. If you understand how they are formed, you’ll understand what makes prices move.
Stephen W. Bigalow is author of “Profitable Candlestick Investing, Pinpointing Market Turns to Maximize Profits” and “High Profit Candlestick Patterns” and principal of the www.candlestickforum.com, the leading website on the Internet for providing information and educational material about Japanese Candlestick investing. Over eighteen years of extensive study and utilization of candlestick analysis has produced an array of easy-to-learn educational material about Candlesticks. As one of the leading Candlestick experts in the nation, Mr. Bigalow, through his consulting with major trading firms, has developed multiple successful trading programs, utilized in his candlestick trading hedge fund, for the day-trader to the long-term hold investor.