Stock Market Analysis and Fibonacci, Part 1
Technical and fundamental analysis are based on the assumption that things have happened in the past will often indicate what will happen in the future. Fundamental analysis depend on the past underlying financial performance of a company or industry to make forecasts while technical analysis will look at past stock price movements for the same purpose. From that perspective you can imagine fibonacci analysis as the technical equivalent to the fundamentals of discounting cash flows or projecting financial ratios.
Fibonacci analysis is a way to forecast levels of support and resistance and project price targets. It can be used to set stops as well as timing entries, however, the most valuable information is what it can tell us about risk. In this lesson we will be introducing a few of the tactical concepts and tips you will need to understand these tools and begin using them as a technical analyst. Through the subsequent sections in this lesson we will examine several case studies to understand how these ratios work in the live market and why they are considered one of the most important tools available to technical analysts.
Click here to order your copy of The VXX Trend Following Strategy today and be one of the very first traders to utilize these unique strategies. This guidebook will make you a better, more powerful trader.
Fibonacci Concepts
What are the ratios and how are they used?
I will spare you the long, historical (and mostly erroneous) explanation of where the Fibonacci ratios come from and how it appears in the natural world except to say that fibonacci analysis is based on the fibonacci number series and the Fibonacci ratios, which are then applied to price charts. While there are many Fibonacci ratios, in my experience, it is sufficient to stick with the standard levels of 23.6%, 38.2%, 50%, 61.8%, 100% and 161.8%. Slicing these levels into thinner segments results in a crowded chart and probably won’t improve your analysis.
How are fibonacci ratios calculated?
The ratios are based on the distance between fibonacci numbers. If we use three numbers from a simple fibonacci series (1,1,2,3,5,8,13,21,34,55…) you can see how this works in the examples below.
1. (34-21)/34 = 38.2% 2. (34-21)/55 = 23.6% 3. (34-21)/21 = 61.8%
Where do the lines go?
The sticky part of fundamental and technical analysis is that they are both very subjective, which means that they allow for a great deal of interpretation and individual preference. However, with Fibonacci analysis that subjectivity is easy to handle and I have a few good example to show you why.
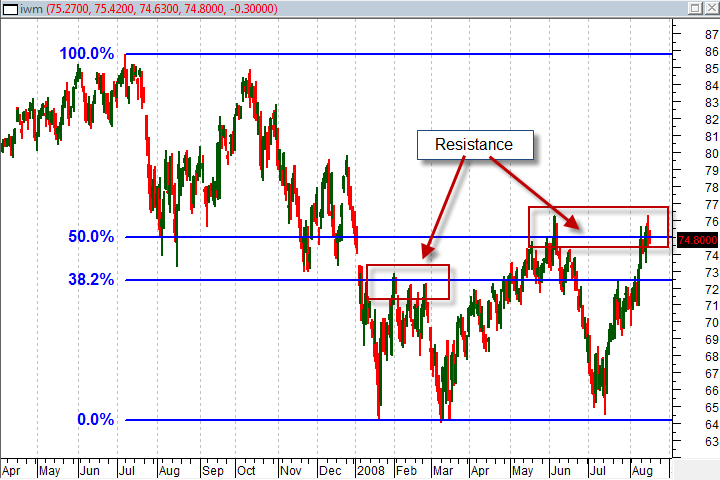
In the chart below you can see a Fibonacci retracement drawn from the “top” of the market in July to the “bottom” of that trend in January where prices started to move back up. Once prices started to move back against the trend in late January we could anchor our Fibonacci retracement lines to that bottom. That analysis may seem a little subjective but I can show that as long as you are picking extremes in the trend it really won’t matter. I have simplified the chart to just show the 38.2% and 50% retracement levels. These two levels have served as likely consolidation areas over the subsequent months and currently the market is sitting at the 50% zone again indicating a positive trend that is at risk.

Bodies or shadows?
There is always a minor debate about whether you should anchor your Fibonacci retracement to the body of a candle or the shadows. I prefer to use the shadows so that the study includes the extremes of market sentiment. Most of the time, the difference is insignificant but sometimes it can be critical. In the examples above you can see that I anchored the Fibonacci retracement to the shadows of the candles at the top and bottom of the trend.
Support and resistance lines or areas?
I feel that support and resistance is more often an area around the Fibonacci lines than a specific to-the-penny point in the charts. You will find that prices move around a support or resistance line, especially during a consolidation. Discounting that level because of a temporary break may lead you to ignore a valid signal in the future. In the examples I will use in this lesson I will show how to evaluate that support and resistance area and how to use it to be aware of risk as well as opportunities.
John Jagerson is the author of many investing books and is a co-founder of LearningMarkets.com and ProfitingWithForex.com. His articles are regularly featured on online investing publications across the web.
