Using the Baltic Dry Index As Predictive Tool for The U.S. Stock Market
As the U.S. stock market oscillates in an ever tightening trading range, investors around the world are trying to read the tea leaves to determine what will happen next.
One esoteric and unusual indicator, The Baltic Dry Index, points to a sustained uptrend but one that could be reaching at least a short term peak.
Click here to order your copy of The VXX Trend Following Strategy today and be one of the very first traders to utilize these unique strategies. This guidebook will make you a better, more powerful trader.
Many investors and traders see Baltic Dry as a leading economic indicator and looking back at its rise in February and March, it certainly seemed to accurately predict the powerful bear market rally that took off after the March 6th lows.
Here’s how it works and what it might mean going forward.
The Baltic Dry Indicator started in London in approximately 1744 and is a measure of the daily cost of shipping raw materials by boat around the world. The index tracks dry bulk cargo vessels used for transporting commodities like iron ore coal and agricultural products. And what it really measures is shipping demand against the worldwide available capacity on dry bulk ships.
When this indicator rises, it indicates a rise in global demand for raw materials and commodities and when it falls, it indicates lagging demand for these items. And demand for raw materials is a predictor for future economic activity because when producers want to build cars, roads, or buildings, they order more raw materials required for their products. These orders lead to increased shipping activity and the index rises.
As we all know, rising industrial activity usually points to economic growth and rising stock and commodity prices and so that’s why many economists and analysts track this index.
The index peaked in the spring of 2008 and then over the next sixth months collapsed by more than 90% reaching its lowest level since 1986 in December, 2008. Not surprisingly, this steep decline coincided with the worst recession we’ve seen in decades.
And then in early 2009, it made an abrupt turn around and started gaining ground as worldwide shipping picked up around the world. At its peak it was over 12,000 and even after the recent impressive rally, rests at approximately 2600, some 80% below its previous highs. This number alone gives a stark picture of the depths of the global recession we’ve been experiencing.
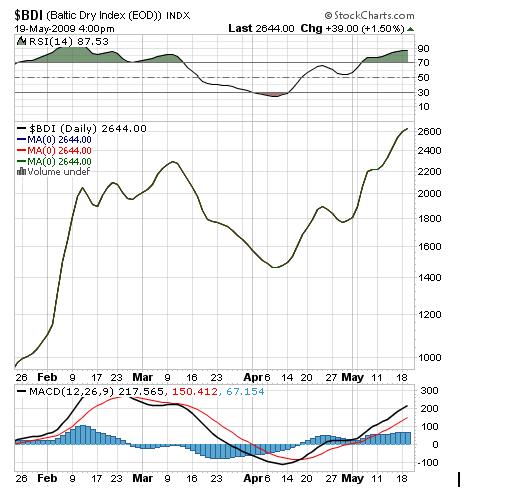
Many economists and market analysts will tell you that moves in this index precede moves in the stock market, both up and down, because global demand for raw materials is an early warning indicator of future economic production. For the last two weeks, in particular, The Baltic Dry Index has been on a bullish tear:
The primary advantage of the Baltic Dry Goods Index over other leading economic indicators is that it is a very clear indicator of supply and demand in global shipping. The supply of freighters is very stable and so when freighter demand rises, the index climbs because shippers don’t book freighters unless they actually plan on using them and there is no element of speculation in this index.
A rising Baltic Dry Index typically points to increased global economic activity, increased production, rising stock prices, rising commodity prices, rising interest rates and rising value in commodity based currencies like the New Zealand and Australian Dollar.
And a declining Baltic Dry Index indicates the opposite elements of global economic contraction.
But the question on everyone’s mind is “is this bear market rally sustainable?”
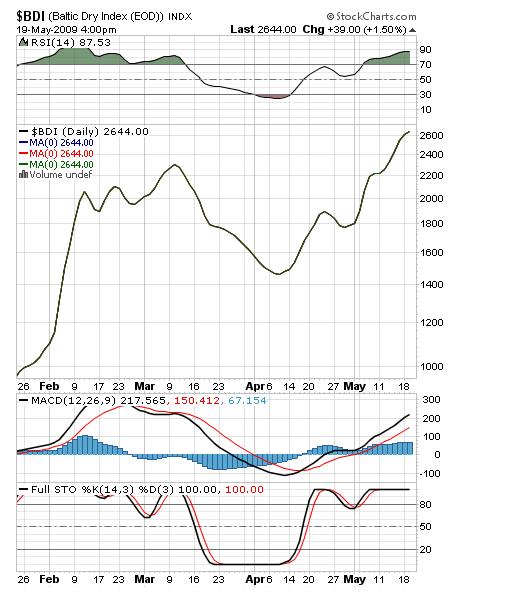
Taking a closer look at the BDI indicates that at least a short term top to the recent rally might be at hand.
You can see how the RSI is vastly overbought and how the Full Stochastics are in the Overbought zone and starting to roll over towards a “sell” signal.
Trading the BDI
For us as traders, the BDI can be a useful leading indicator for the major indexes as it tends to be very closely correlated to the S&P 500.
Also we have the option to trade several companies that specialize in the shipping of dry goods around the world, and a look at their charts is instructive and potentially profitable.
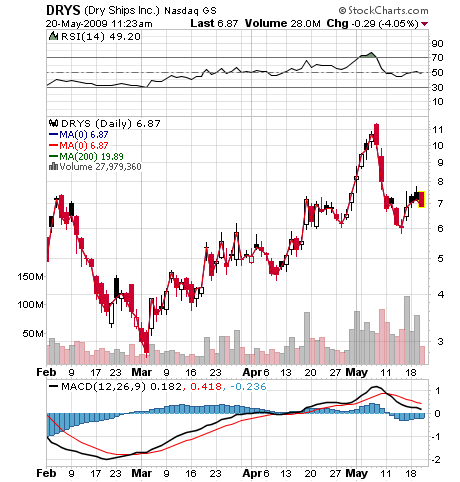
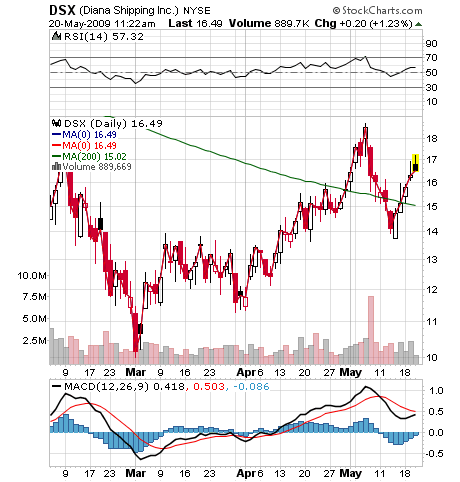
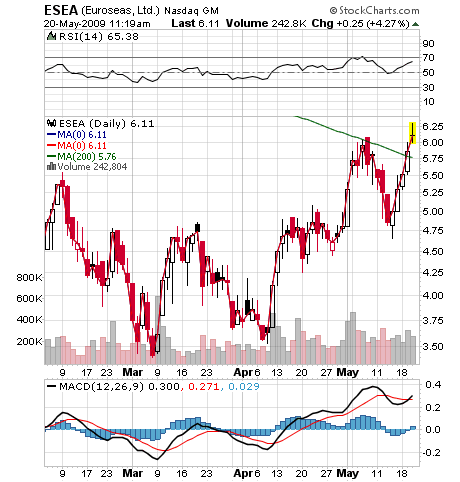
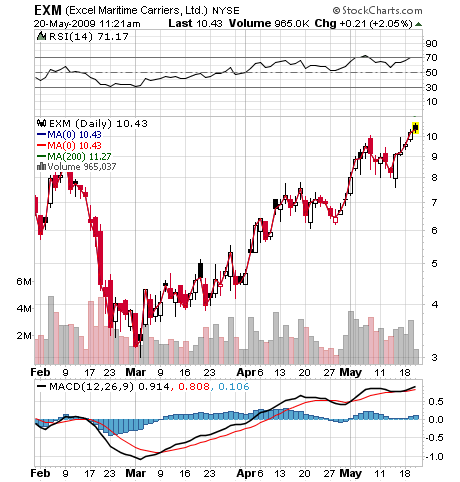
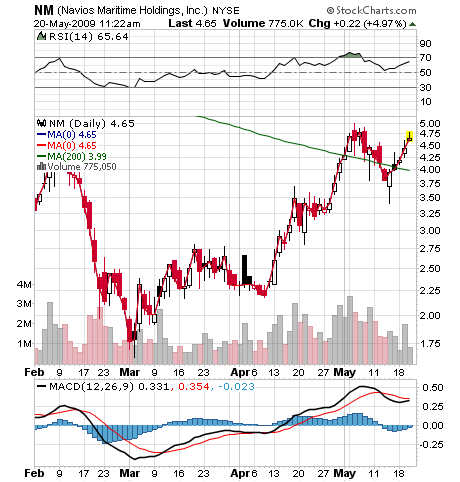
The above companies, Dry Ships, Inc, Diana Shipping, Euroseas Limited, Excel Maritime and Navios Maritime are all very liquid and tradable issues that offer traders the opportunity to trade the trends in the Baltic Dry Index. Like the index, most of these are in up trends but reaching oversold levels.
For the most part these issues move in nice, tradable trends and tend to have low volatility because shippers are booking space that they plan to use and so forward looking revenue forecasts tend to be stable.
As a trader in this sector, you can apply your normal trading techniques to these stocks or any of the short term trading techniques highlighted in Larry Connors’ new book, High Probability ETF Trading, to get an edge through the course of these difficult and volatile days.
The Baltic Dry Goods Index is another valuable tool that could give you a peak into the future and trading the shipping companies moving raw materials around the world can be another valuable addition to your trading arsenal.
Disclaimer: All material herein is believed to be correct but its accuracy is not guaranteed. This article represents solely the opinions of John Nyaradi and readers are encouraged to consult their investment advisors prior to making any investment decisions. All information herein is for general informational and educational purposes only. The information is of an impersonal nature and should not be construed as individualized advice or investment recommendations. There is risk of loss in all trading and readers are encouraged to read the full at https://www.wallstreetsectorselector.com/disclaimer.html. None of the information in this article is intended to be investment advice or any kind or offer or solicitation to buy, sell or otherwise invest in any fund, company or security. Nothing herein represents a recommendation, claim, promise, guarantee or warranty regarding the suitability or profitability of any investment.
John Nyaradi is Publisher of Wall Street Sector Selector, an online newsletter specializing in sector rotation trading using Exchange Traded Funds.

