Buying Weakness and Selling Strength
In an earlier article, “How I Apply Connors’ RSI(2) to Trading Pullback“, I showed how one could implement the 2-period RSI trigger for fundamentally sound stocks with value remaining in their price. This is the group that I tend to trade because the safety net of institutional interest is always there, as opposed to trading any stock that meets the trade’s trigger criteria. The only concern with my limited stock universe would be that there might not be enough signals. This work clearly shows that’s not the case.
Click here to order your copy of The VXX Trend Following Strategy today and be one of the very first traders to utilize these unique strategies. This guidebook will make you a better, more powerful trader.
TripleScreenMethod’s Approach
TSM’s stock trading strategy has been to identify weekly a group of 50 to 100 stocks that meet fundamental criteria (membership in at least 2 of 15 fundamental screens) and have value left in their current price as measured by the next two year’s PEG ratios. This grouping forms a watch list from which buys are forecast for the coming week. Each buy forecast aims to buy weakness and sell strength. This summary describes a very successful strategy designed to do just that.
Buying Weakness and Selling Strength: The Strategy
Larry Connors has thoroughly tested the Relative Strength Index, specifically the 2-period RSI, as a trigger both for entering and exiting stock and ETF trades. He’s developed strategies and tested them thoroughly over millions of historical trades, but he’s made no distinction with respect to a stock’s fundamentals, probably because it’s easier to test price than the array of fundamentals possible. In any case, I’ve explored the usefulness of these RSI(2) triggers for trading TSM stocks with their fundamentals and values.
The strategy is simple, just five rules:
- Stock has passed TSM’s fundamentals and value screening;
- Stock’s price is above its 200-day moving average;
- Stock’s daily RSI(2) has fallen below 15 for two consecutive days;
- Buy the Close (or near it) on the second day (or the Open of the next day);
- Sell the Close, the day when RSI(2) rises above 80 (a dynamic rather than static exit),
or again, at the Open of the next day.
Strategy’s Performance in 2008 and 2009
Let’s look first at 2009. It was a very good year for the market as evidenced by the 23.5 percent gain in the S&P 500. There were 90 unique TSM stocks forecast during the year, many multiple times. The following table summarizes the trades that could have been made during the year for this set of stocks utilizing the above strategy (shown in the center statistics), as well as eight modified strategies (1 to 3 days below RSI(2) trigger and RSI(2) buy trigger from 5 to 25). These 90 stocks generated 368 winning, 69 losing trades and a 84.21 percent win rate to average a $1.00 gain per trade per share traded and 438.81 total points gained over the year. Note, the statistics to the left and below each set are subsets of the primary strategy.
That’s all well and good for a good year in the market, but how did the strategy perform in 2008, a big down year for that market. As you can see in the following table, the win rate dropped to 80.38 percent, but the average gain per trade per share increased to $1.60 and the total number of points gained likewise improved (to 669.31). Obviously, the strategy didn’t suffer the whims of the market.
Now let’s look at the statistics generated when the buy and sell occurs at the opening of the next day instead of the close of the day the triggers signaled. Compare the data below to the first table. While the win rate fell off a bit to 82.17 percent, the total points earned rose to 446.55. Not much difference for a strategy modification that allows one to set up trades in the evening rather than trying to catch each close.
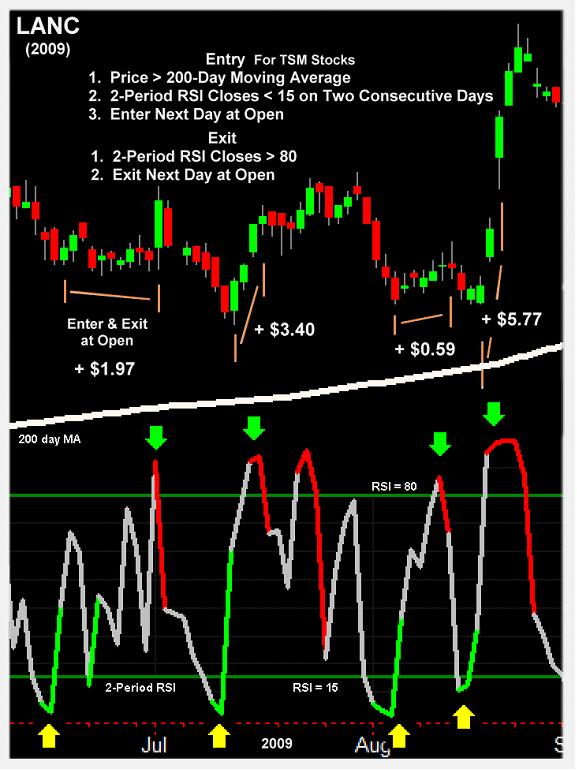
Finally, this last chart shows the Open-to-Open strategy in action. LANC generated nine trades in 2009, and eight were profitable. Four of the latter, covering a three-month period, are shown in the chart. Arrows indicate entry and exit days on the RSI(2) chart, while vertical lines show the same thing on the price chart. A 1,000 share trade for each of these trades would have generated $11,730 in profit.
Richard Miller, Ph.D. – Statistics Professional, is the president of TripleScreenMethod.com and PensacolaProcessOptimizaton.com.
Do you trade FAS, FAZ, SSO, SDS, TZA or TNA? Introducing Leveraged ETF PowerRatings, a simple but powerful rating system for Leveraged ETFs. Click here to see today’s ratings.


