 Connors Research, the research affiliate of TradingMarkets, has been developing, testing, and publishing quantified trading strategies since the mid-1990s. During that time, we have had the opportunity to evaluate a great number of different technical indicators and to assess their effectiveness in predicting future price action.
The 2-period RSI is used by thousands of traders around the world. In fact, it’s considered by many to be the single best indicator for Swing Traders. Over the past decade professional equity, ETF, and options traders have learned to rely upon the 2-period RSI as their main indicator before they make a trade.
Now we’ve taken the next step and created ConnorsRSI.
ConnorsRSI is a composite indicator consisting of three components. Two of the three components utilize the Relative Strength Index (RSI) calculations developed by Welles Wilder in the 1970’s, and the third component ranks the most recent price change on a scale of 0 to 100.
Taken together, these three factors form a momentum oscillator, i.e. an indicator that fluctuates between 0 and 100 to indicate the level to which a security is overbought (high values) or oversold (low values).
FREE ConnorsRSI Strategy Guidebook
ConnorsRSI is being offered at no cost — with full disclosure of the formula & test results. We have published an introductory guidebook that includes:
- The Formula for ConnorsRSI
- A Fully-Disclosed ConnorsRSI Pullback Strategy
- Simulated Historical Test Results
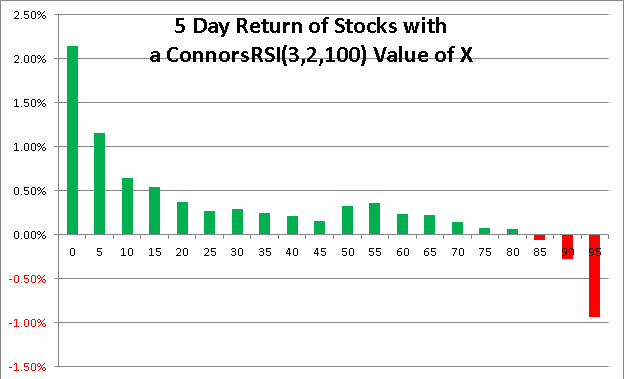
The chart below shows simulated historical research results from this strategy from 2001 and has been updated through February 2014 in the 2nd Edition!

For your convenience, we also offer ConnorsRSI add-on module code for AmiBroker, MetaStock, thinkorswim and TradeStation.
