Eagle Flies Out Of The Range
Wait for analysts, you’ll miss the big
move every time. But act on the breakout, and you can read about the rosy
analyst reports later while the herd falls over itself buying the stock behind
you.
American Eagle Outfitters
(
AEOS |
Quote |
Chart |
News |
PowerRating)
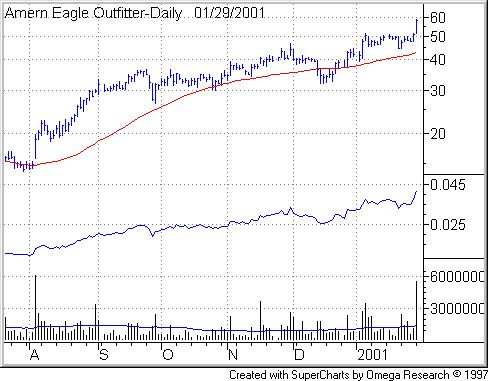
shot out of a tight, three-week consolidation zone, gaining 7 3/8 to a new
52-week high of 58 3/16 on four times its usual trade. The move came after the
news wires carried bullish analyst comments on the company’s youth sales in
2001. Marcia Aaron of Deutsche Bank Alex Brown, who rates the stock a
“strong buy,” told Reuters that the company’s target demographic, teenagers, is much
less likely to be slowed by the current slowdown in general consumer spending.

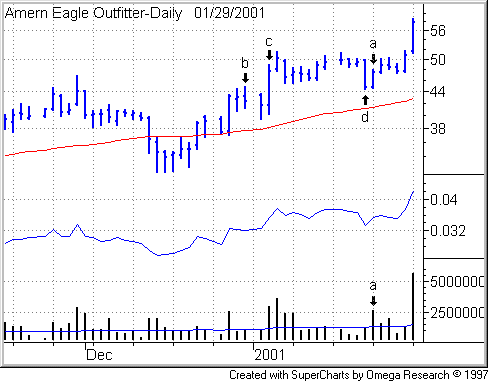
Let’s take a closer view. Note how the
structure tightened right back up after the nice recovery on higher volume on
Jan. 22 (Point a in the following chart).
Also note the stock’s behavior relative to its recent history. On Jan. 3 (Point
c), the stock broke out of a cup-with-handle/ascending base as it
exceeded the handle high formed on Dec. 29 (Point b).
Notice how the Jan. 19 test (Point d) barely
grazed below the Dec. 29 high and closed above it. This is healthy action.
Classic technical analysis: after a breakout, prior resistance should become
support. For more on the Jan. 3 ascending base/cup-with-handle breakout, see my
commentary.

Another fact stands out clearly in the
above chart. When the stock broke out Monday, notice how the day’s trading range
— more than seven points — exceeded any previous day’s range within the
pattern. You have to go back to the Jan. 3 cup-with-handle breakout to find a
bigger day. I’ll tell you more about the significant juncture of tight patterns
with an explosive range breakout momentarily. But first let’s look at some other
tight consolidators.
First American Financial
(
FAF |
Quote |
Chart |
News |
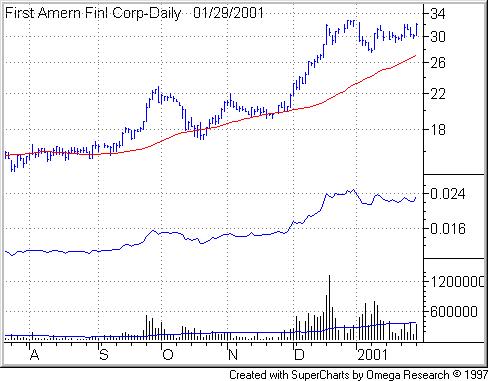
PowerRating) is
putting in a high consolidation area after a strong uptrend. The buy point for
these structures comes if the stock exceeds the high of the pattern by 1/8 on
heavy volume. The company may be benefiting from the positive action in home
building industry stocks, which have been discounting renewed activity in the
face of falling interest rates. First American is engaged in three business
segments: title insurance and services, real estate information and services,
and consumer information and services.

Another consolidator on my radar
screen is IPC Holdings
(
IPCR |
Quote |
Chart |
News |
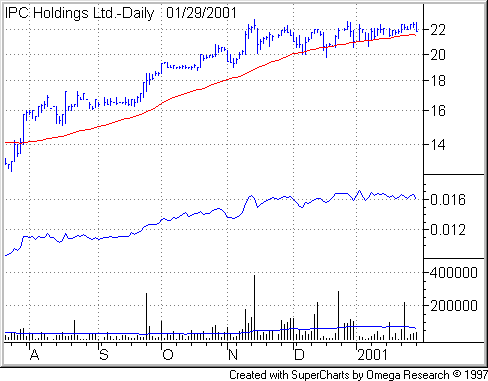
PowerRating). As with First American Financial, IPC
combines a strong intermediate-term uptrend with a tight consolidation zone.

The point of looking for tight
consolidation zones following up trends is twofold: First, a contraction in
daily price ranges combined with a dry-up in trading volume after a strong
advance indicates profit-taking is minimal. Second, when price does expand
substantially to the upside on strong volume, the move stands out clearly. Your
pivot points are obvious, and thanks to the general narrowness of the pattern,
the stock will trip your pivot and send a buy signal without becoming too
extended and thus too prone to pull back and shake you out.
Finally, an explosion in price range
in the direction of the prior trend after a narrow formation tells you of an
important, trend-resuming shift in a stock’s behavior.
To quote Paul Tudor Jones, in the
original Market
Wizards book: “… (M)arkets move sharply when they move. If
there is a sudden range expansion in a market that has been trading narrowly,
human nature is to try to fade that price move. When you get a range expansion,
the market is sending you a very loud, clear signal that the market is getting
ready to move in the direction of that expansion.”
The top field of all
charts in this commentary uses a logarithmic price scale and displays a 50-day
price average in red.
In the second field, a blue relative strength line represents the displayed
security’s price performance relative to the S&P 500. The third field
displays vertical daily volume bars in black with a 50-day moving average in
blue for volume.
Remember that all stocks are
speculative and risky. On any trade, reduce your risk by limiting your position size to a percentage of your total
account and setting inviolable price stops. For an intro to combining stops with
position sizing, check out my lesson, Risky Business.
