Market Probability for Short Term Reversal
From 1990 to 1997, Kevin Haggerty served as Senior Vice President for Equity Trading at Fidelity Capital Markets, Boston, a division of Fidelity Investments. He was responsible for all U.S. institutional Listed, OTC and Option trading in addition to all major Exchange Floor Executions. For a free trial to Kevin’s Daily Trading Report, please click here.

This is the actual commentary posted in the Trading Service over the weekend, with the exception of some actual proprietary trades.
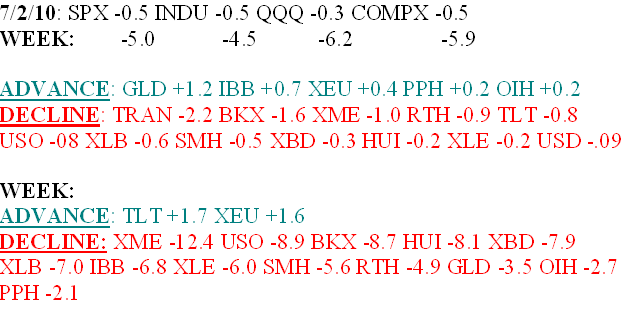
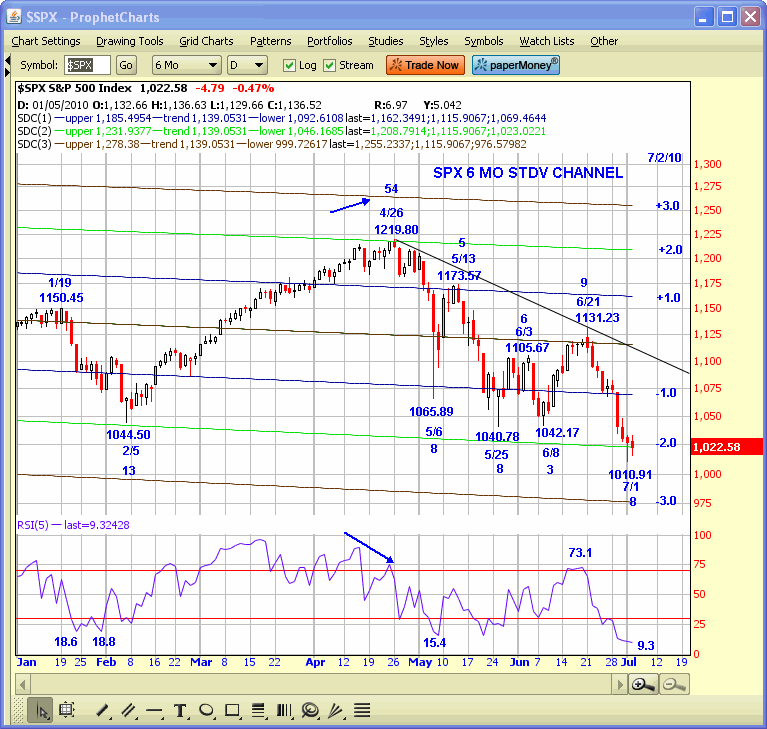
The SPX quickly reversed its B/O above the 1100 200DEMA after making the 1131.23 high versus the .50RT to 1219.80 from 1010.9, and then took out the 1040.78 double bottom to make a new low at 1010.91 on Thursday, which was day 8 of the decline. I guess we can label it the “Double Dip” decline because the “herd” all jumped on the same train.
The market is as O/S on a ST daily momentum basis as it was on 10/10/08 during the “Panic of 2008” when the 5RSI was 8.9, as the SPX declined 7 straight days and -28% to 839.80 from 1167, which was followed by a +24% pop to 1044.31 in 2 days. The SPX finished last week -5.0% on an inside day with a 5-period RSI of 9.3
The SPX has declined -10.6% in 8 days from 1131.23 to the 1010.91 low, followed by the inside day close on Friday at 1022.58, which is day 48 of the -17.1% decline from the 4/26 1219.80 cycle high, versus the 1229 .618RT to 1576 from 667, so it remains in the “death zone”, which is from 45-49 trading days. The QQQ has declined 11 straight days and the SPX 9 of 10.
It is significant to note that there have been 7 different moves since the 1219.80 high, and 5 of them have been exact Fib day counts, while the other 2 missed by a day. Also, there were 13 days down from the 1/19 1150.45 high to the 2/5 1044.50 low, followed by the 54 day [55] advance to the 1219.80 high, so there has been significant Fib day count symmetry YTD. There has also been significant Fib ratio and RT symmetry.
I have included the SPX 6 MO STDV Channel daily chart so you can see that the SPX has hit the -2.0 STDV band and has not closed below it. You can also see that the 1044.50 low and 1219.80 high were right at their 2.0 STDV bands before reversing, so from a technical perspective the highest probability is a reversal in the next couple of days.
NYSE volume was 1.10 bill shs, with the VR 27, BR 40, and breadth -612. The 4MA’s are ST-O/S at 27 and 31, which also increases the odds for a reversal to the 1075-1100 zone.
However, markets can remain O/S longer than traders can remain solvent, so with the trend down and the major indexes trading below their 200DEMA’s, if you carry anything over make sure there is a profit cushion.

Have a good trading day!
Click here to find full details on Kevin’s courses including Trading with the Generals with over 20 hours of professional market strategies. And for a free trial to Kevin’s daily trading service, click here.
