Market and Reality Negative Divergence
From 1990 to 1997, Kevin Haggerty served as Senior Vice President for Equity Trading at Fidelity Capital Markets, Boston, a division of Fidelity Investments. He was responsible for all U.S. institutional Listed, OTC and Option trading in addition to all major Exchange Floor Executions. For a free trial to Kevin’s Daily Trading Report, please click here.
Commentary for August 9, 2010
The SPX made a new rally high last Wednesday at 1128.75, which is a +11.6% advance from the 1010.91 7/1/10 low. The index had a +2.2 thrust day on Monday with a high of 1127.30, and closed at 1125.86. The SPX has made daily highs the last 4 days at 1125.44, 1128.75, 1126.56, and 1123.06, but has closed near the highs on all 4 days at 1120.46, 1127.24, 1125.81 and 1121.64
On the year the SPX is essentially flat at +0.6%, and closed +1.8% last week to 1121.64 on the lowest NYSE average weekly volume this year of 974mm shs. The continued weakness in economic statistics and Washington’s indefensible economic and financial polices have a growing crowd concerned about a double dip recession, or even deflation. The 10-year Treasury note yield made new lows last week and closed at 2.817%, which is down from the 4.013 high on 4/5/10. This decline in yields certainly supports that case.
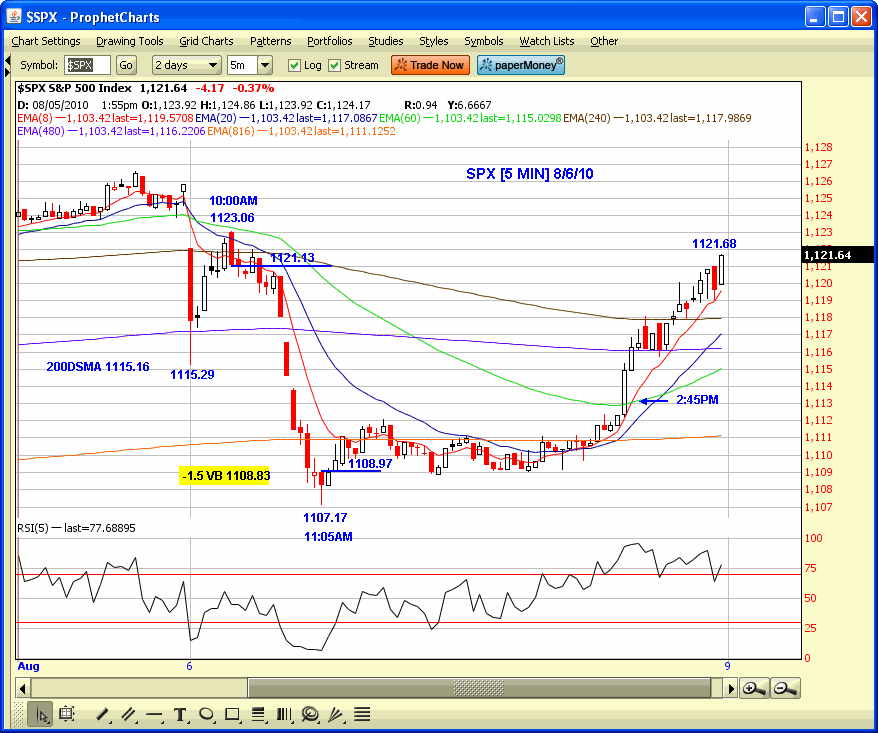
There was a sharp discount NYSE opening on Thursday because of the weak jobless claims report to an 1118.81 intraday low, but it worked its way back up to close at 1125.81. We saw a repeat performance on Friday because of the weak jobs report and downside revisions for the previous 2 months which means those numbers were probably overstated for political purposes. On Friday the SPX hit an 1115.29 low on the opening bar and reversed immediately to the 1123.06 high on the 10:00AM bar.
There is usually a tradable contra move 90% of the time after most significant discount or premium NYSE openings, and 60% of the time price will resume the direction of the opening. In this case there was a Gap Pullback to the SPX 1123.06 high and reversal bar [5-min chart], so most trading service members took the short entry below 1121.13 versus the 1121 .50RT to 1576 from 667.
The index traded down to an 1107.17 low versus the 1108.83 -1.5 VB, and then went sideways all day until we got the mysterious vertical +10 point spike from nowhere on the 2:45PM bar. It looked like someone wanted the SPX to close above the 1115.16 200DSMA, and it obviously wouldn’t be a surprise to anyone if it was the manipulating PPT [Plunge Protection Team] in action after the weak jobs report and downside revisions.
The immediate SPX resistance zone is the 1140 .618RT to 1219.80 from the 1010.91 low, followed by the 1150.45 1/19/10 high.

Have a good trading day!
Click here to find full details on Kevin’s courses including Trading with the Generals with over 20 hours of professional market strategies. And for a free trial to Kevin’s daily trading service, click here.
