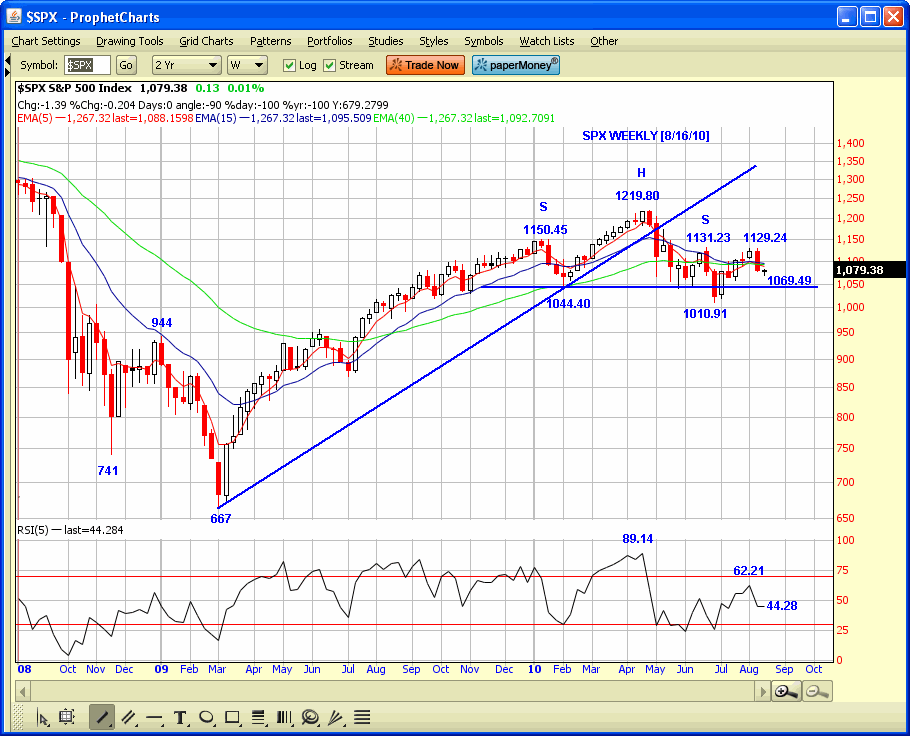
Market Remains in Weekly Chart H&S
From 1990 to 1997, Kevin Haggerty served as Senior Vice President for Equity Trading at Fidelity Capital Markets, Boston, a division of Fidelity Investments. He was responsible for all U.S. institutional Listed, OTC and Option trading in addition to all major Exchange Floor Executions. For a free trial to Kevin’s Daily Trading Report, please click here.
Commentary for 8/17/10
The SPX finished last week on 4 straight down days to 1079.25 or -3.8%. There was a weekly reversal in the XEU at -4.0%, and USD +3.2%. The TLT was +2.2% while the GLD was +1.6%. The crowd psychology has swung over to double dip/deflation, but they are a little late in the game as the market has been divorced from reality for quite some time.
The volume has been very light on this decline from the August key time date, and it was the same way on the way up for the entire rally. The SPX had declined -4.7% in 3 days last week to a 1076.69 low and the hit 1069.49 yesterday, or -5.3%, and the SPX finished flat at 1079.28.
The NYSE volume was only 789mm shs yesterday, as the SPX was +.01 to 1079.38. However, the 4-day moving averages [4DMA’s] of the volume ratio [VR] and breadth ratio [BR] finished the week short term oversold [S/T-O/S] at 26 and 32, so we expect the market to rally this week and then resume its downtrend. The SPX was essentially flat yesterday, but the SPX futures are +8.4 points as I complete this at 9.00A M.
The news is that the Spanish and Ireland auctions went well, but that is the media B—S— and the reality is that the futures are being gamed because of the short term market oversold condition.
The SPX 5RSI was 20.08 last week on the daily chart, but is only 44.28 as of yesterday on the weekly chart, so it has room to go before it is O/S on the weekly chart, or if it negates the H&S by taking out the 1131.23 high. I expect it to take out the 1010.91 low before the Sept/Oct period is over. Investors should ignore the daily fluctuations and leave those to the short term traders, while they concentrate on what the weekly and monthly charts look like.

Have a good trading day!
Click here to find full details on Kevin’s courses including Trading with the Generals with over 20 hours of professional market strategies. And for a free trial to Kevin’s daily trading service, click here.
