The Fed Remains the Primary Driver of the Market
From 1990 to 1997, Kevin Haggerty served as Senior Vice President for Equity Trading at Fidelity Capital Markets, Boston, a division of Fidelity Investments. He was responsible for all U.S. institutional Listed, OTC and Option trading in addition to all major Exchange Floor Executions. For a free trial to Kevin’s Daily Trading Report, please click here.
Commentary for 1/3/11
The SPX went dead in the last ten days of the year as the SPX traded in a very narrow range from 1251.48-1262.60 [0.9%] and closed the year at 1257.88, which was +12.8% on the year as half of that gain came in Dec which was +6.5% on decling volume and breadth. The Dec rally was led by a shrinking universe of big cap stocks and a moving average of NYSE highs has been trending lower.
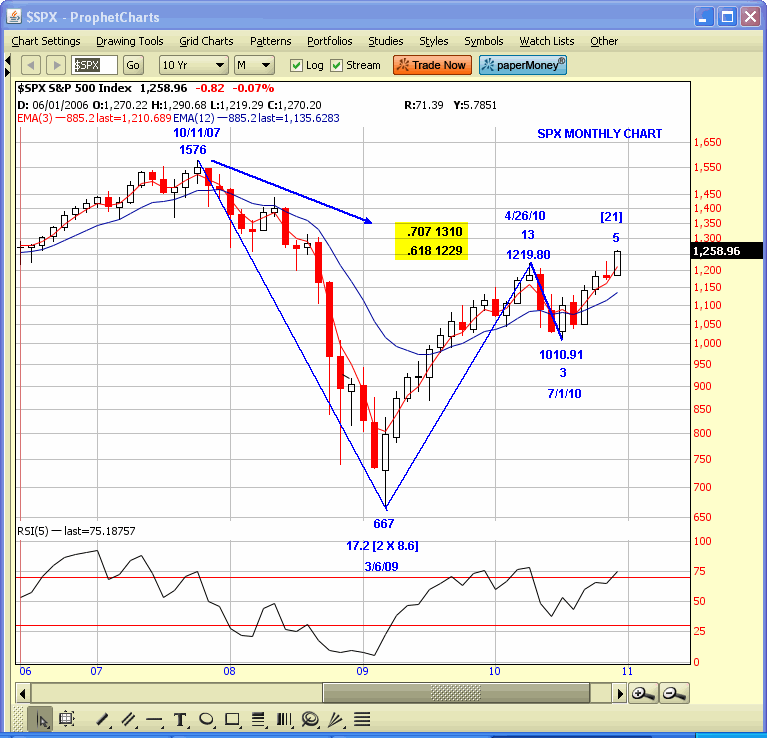
The last significant SPX decline in 2010 was -17.2% from the 4/26/10 1219.80 high to the 7/1/10 1010.91 low, and then it was a +24.5% advance into year end. This second bull cycle within the secular bear market that began in 2000 is now +89%, versus the first bull cylce from 2002-2007 which was +105%, so the risk reward has obviously changed, and not for the better.
The institutional analysts and economists are all very bullish for 2011, and they have to be because they make money when they sell you products and manage your money, so you won`t hear anything too negative from them, or from the major banks who owe their souls to the Govt that bailed them out. Also, insider selling is at a high as they sell when they can, and not when they have too.
The SPX rallied 13 months to the 4/26/10 1219.80 high, then declined
-17.2% in 3 months to the 7/1/10 1010.91 low, and has now advanced +24.8% in 5 months to the 1262.60 intraday high last week with the high close of this bull cycle at 1259.78 last Wed. The SPX has been trading on a Fib nonthly number count since the 3/6/09 667 low so that is a red alert for a correction in Jan 2011.
The most widely followed bullish sentiment indicators are as bullish as they were at the top in 2007, and the market is extended on a STDV basis. There is minor Fib extension price symmetry from the 1227.08-1173 last leg down at 1260.50 and 1266.67, in addition to Gann angle symmetry at 1263.43 from 1010.91, and 1265.68 from 667, so this all constitutes another red alert, as does the longer term Pi time symmetry from the 10/11/07 1576 top for Jan.
The trivia buffs are out in force quoting the strong seasonality of the 3rd year in a Presidential cycle, especially in Jan. The SPX was up 5 straight days or +2.7% for the 1st week of 2010. However, It was down -0.8% the second week, -3.9% the 3rd week, and -1.6% the last week ending 1/29/10 for a net monthly loss of -3.7%, so you don`t bet the ranch on seasonality.
There is no significant change in trend, by definition, until there is a lower high followed by a lower low [pullback, lower high, follwed by a lower low then the pullback low]. However, the market can easisly make a crash like first move down with no significant pullback so most traders get trapped. The SPX was up 17 of 22 days in Dec with the biggest down day at -0.5% on 12/15/10, and the only two days that it advanced +/- 1.0% or more were the first two days of the month at +2.2% and +1.3%, which was just above 50% of the total advance for Dec. The rest of the month was just back and fill, and certainly looked like some distribution.
The Implied Volatility for the major indexes is just above 52 week lows, so experienced day traders have to use the Ultra Long/Short ETFs to adjust for that, but our primary focus on the commodity ETF`s in the Trading Service continue to pay big dividends for day traders.
The Fed will renew its POMO game today after taking two days off, and the unknown is how long and high can the Fed manipulate this market.
Have a good trading year!

Click here to find full details on Kevin’s courses including Trading with the Generals with over 20 hours of professional market strategies. And for a free trial to Kevin’s daily trading service, click here.
