Key Price and Time Zone Confirmed by Other Technical Evidence
From 1990 to 1997, Kevin Haggerty served as Senior Vice President for Equity Trading at Fidelity Capital Markets, Boston, a division of Fidelity Investments. He was responsible for all U.S. institutional Listed, OTC and Option trading in addition to all major Exchange Floor Executions. For a free trial to Kevin’s Daily Trading Report, please click here.
Commentary for 6/13/11
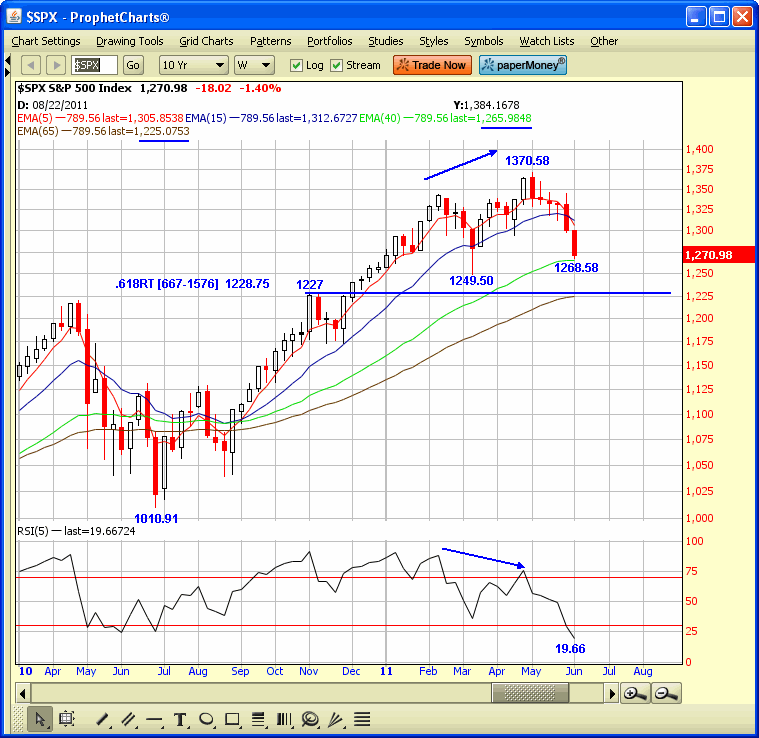
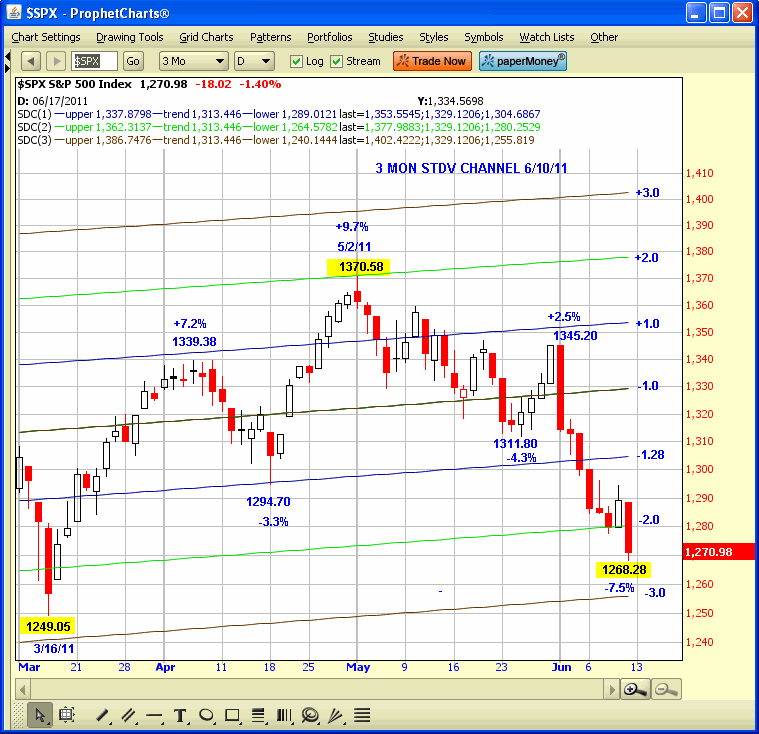
The SPX has now declined -7.5% from the 1370.58 5/2/11 high to the Fri 1268.28 low, and closed the week -2.2% to 1270.98, which is the 6th straight down week, and the first time that has happened since 2002. The market is more O/S on a weekly basis [5RSI] since the week of the 3/6/09 667 low.
In a previous commentary [Timing Reality and the Market] I outlined the significant price and time symmetry in mid June, and said that the SPX correction looked like it would extend down to the 200DEMA, which is now 1262.44 The long term MA zone extends from the 1266 40WK EMA down to the 1225 65 WK EMA, which is only a 3.2% zone. It includes both the 200DEMA and 200DSMA, in addition to the 1249.50 3/16/11 low and the 1228.75 .618RT to 1576 from 667.
The odds are high for a good trading reversal from this key price and time zone, which also includes the 6/13/11 8.6 year cycle time date, in addition to the fact that the zone is confirmed by strong O/S technical evidence, so the probability for a reversal with a positive mathematical expectation of success is high, so the zone can be bought on a scale in basis for traders and investors.
All significant price and time zones confirmed by other technical evidence are high probability contrarian plays, especially, now that most of the fair weather chameleon economists and analysts have switched their spots in just two weeks.


Click here to find full details on Kevin’s courses including Trading with the Generals with over 20 hours of professional market strategies. And for a free trial to Kevin’s daily trading service, click here.
