The EUR/USD Garrison is Holding – For Now
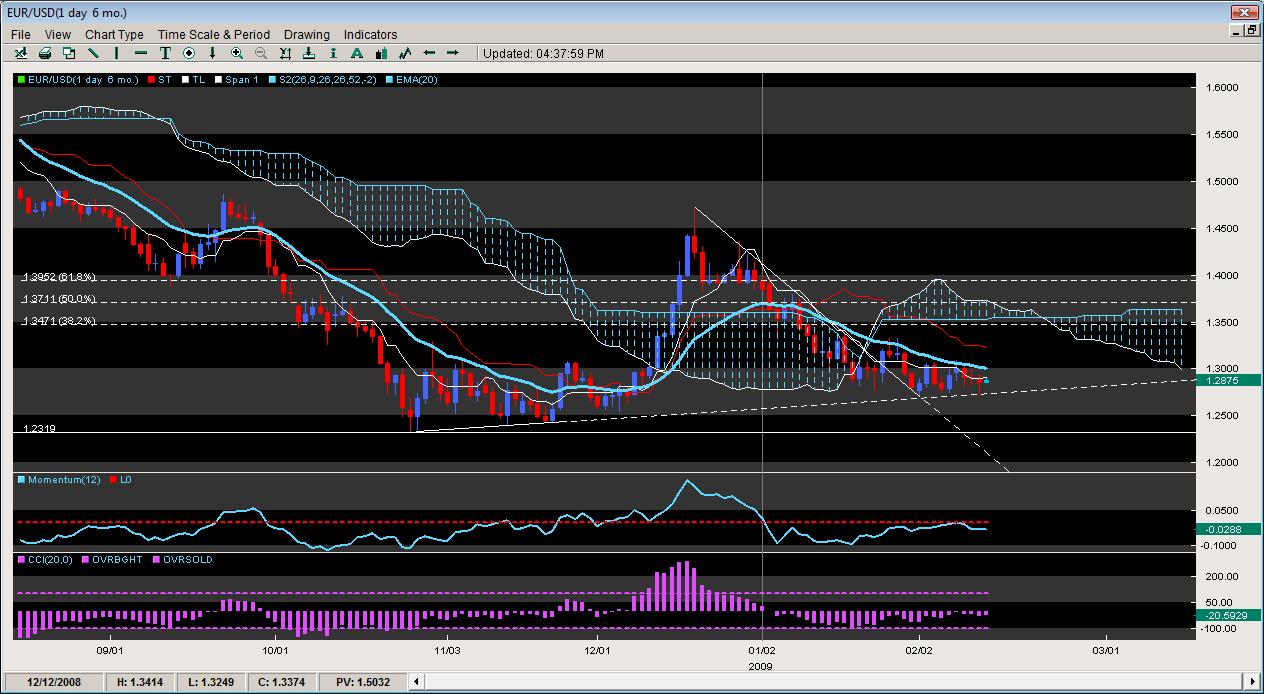
The EUR/USD is putting up a fight holding onto the 4 month trendline as indicated by the chart below and has yet for this year to make a low under the bottom for 2008 (around 1.2300 figure).
As it stands, the garrison the bulls have posted up around is holding but has yet to make any significant dent in the armor of the in-control bears. And while the bulls have had a few skirmishes testing the attack posture of the bears at the moment, the pair has not had a daily close above the 20EMA since Jan. 9th of this year and it has spent a combined 3 days above the 20EMA while posting about 27 days below it.
This does not bode well for bullish technical traders and many of the technical aspects of the daily chart suggest and upside swings need to break through some serious barriers before they can have their day.

Looking at a few of the elements in this chart, we can see the Ichimoku cloud formation has all bear claws to it with the price action spending a total of 15 days above the cloud, about 10 days inside of it but the entire time over the last 6 months below the cloud which is an overall bearish theatre. Right now the Senkou Span B is posting up at 1.3521 and as we look into the future (10 days or so) the cloud flips from Senkou Span A to the topside to the downside suggesting the ceiling will continue to decline and hamper upside gains.

What is also to be noted is the 38.2% fibonacci pulled from the Dec. 18th swing high in 08′ to the lows of this year at 1.2705 on Feb. 2nd. As the chart shows, the 38.2 is posting up at 1.3467 which is sitting shotgun to the Senkou Span. Combine this with a pair of banal oscillators (soggy Momentum and CCI), the upside swing is going to have to contend with these fibs and cloud convergences which may end up being great rally points to sell the pair for another leg down. The other option is for the pair to break this trendline and if the price action gets impulsive with several red candles in a row, then we would likely head towards the 2008 lows around the 1.23 figure and could be making a new 3 year low in the process.
Chris Capre is the Founder of Second Skies LLC which specializes in Trading Systems, Private Mentoring and Advisory services. He has worked for one of the largest retail brokers in the FX market (FXCM) and is now the Fund Manager for White Knight Investments (www.whiteknightfxi.com/index.html). For more information about his services or his company, visit www.2ndskies.com.
