A Simple Way to Trade E-minis With Support and Resistance
I often receive questions as to why I don’t use pivots, moving averages and oscillators to trade the E-mini S&P 500. My reason is I prefer to use real prices such as the open, high, low, close and percentage retracements. I feel that these prices are universal and more likely to draw the attention of active traders. My preference in trading is to trade in active areas rather than dead zones and these price reference points tend to attract the most action.
When I look at a chart I think of 3 dimensions: Horizontal, Vertical and Diagonal. The Horizontal Dimension is Price. The Vertical Dimension is Time. The Diagonal Dimension is Price and Time.
This article looks at the Horizontal Dimension, and how I use it to read the price action on the E-mini S&P 500 chart.
W. D. Gann used a number of methods to determine support and resistance. Using his methodology, he determined that support and resistance exist horizontally and diagonally. The horizontal support consists of swing tops, swing bottoms, the open, high, low, close and percentage retracement points. They are known as horizontal points because when drawn on a chart, you can draw a line from each price and extend it horizontally far to the right. The swing chart support and resistance points move on into infinity while the percentage levels remain intact as long as the market remains inside of the range that created them. Diagonal support and resistance, on the other hand, are created by Gann angles. The intersection of the two methods becomes a strong support or resistance level.
The most important percentage retracement point is 50% of the range. This is the price most often traded while a market is inside a range. When a market is in an uptrend, this price is support when the market is trading over this price. If the market breaks under this level, it indicates weakness and a further decline, but does not change the trend to down such as when it crosses a swing bottom.
When a market is in a downtrend, the 50% price is resistance when trading under this price. If the market breaks over this level, it indicates strength and a further rally, but does not change the trend to up such as when it crosses a swing top.
As mentioned earlier, the most important percentage retracement point is 50% of a major range. This major range can be the all-time range or the next two or three all-time ranges. In addition, the 50% price of a contract range along with 50% prices of a main range on the monthly chart, the weekly chart, or the daily chart can provide invaluable support or resistance. The daily chart itself can even be broken into day session and 24-hour periods. Like other price concepts, combinations or clusters of 50% prices can provide direction as well as solid support and resistance.
The bigger the range, the better the 50% price, as the market is expected to remain inside the larger ranges for a lengthy period of time. The longer the market spends inside a range, the more the trader can learn about the 50% price. Price clusters created by “ranges within ranges” are very important, as the 50% points of each range are often very close in price and form very solid support or resistance points from which to buy or sell.
The key to working with percentage retracements is to work with the major ranges down to the minor ranges. If possible combine the retracement levels with other price levels to like old tops and bottoms and the open. When trading using the 50% price, it is suggested to trade in the direction of the main trend. If the main trend is up, then look to buy breaks into the 50% price. If the main trend is down, then look to sell rallies into the 50% price.
E-mini S&P 500 Example
Let’s look at the horizontal prices for example. Some traders like to use the Horizontals but they don’t have an idea when the price can get hit. Some traders like to use Time but they don’t have an idea where the market will be. The Diagonal gives you a clue as to when and where a price can get hit.
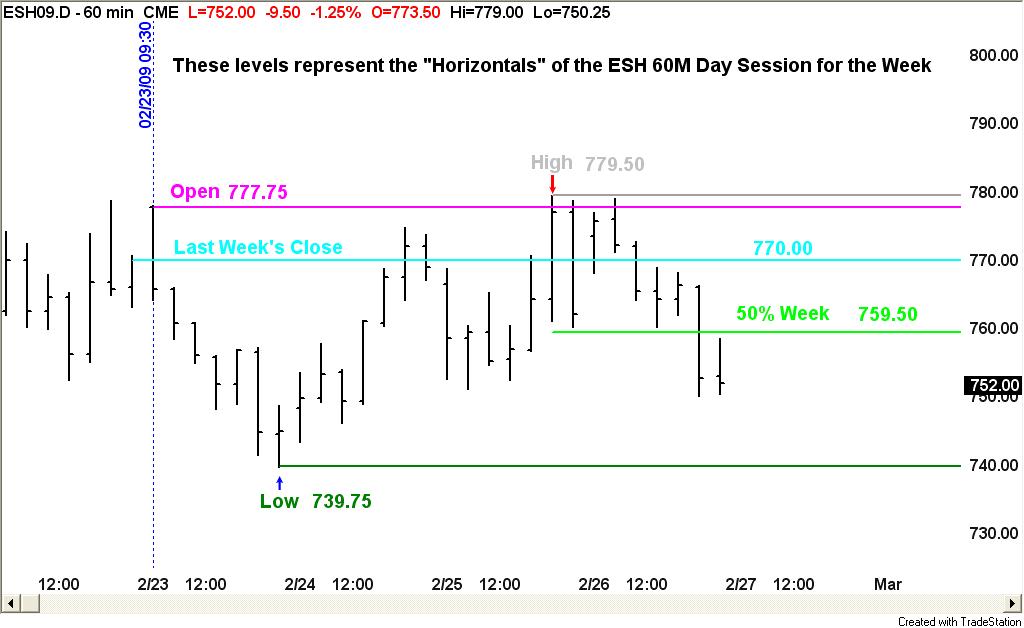
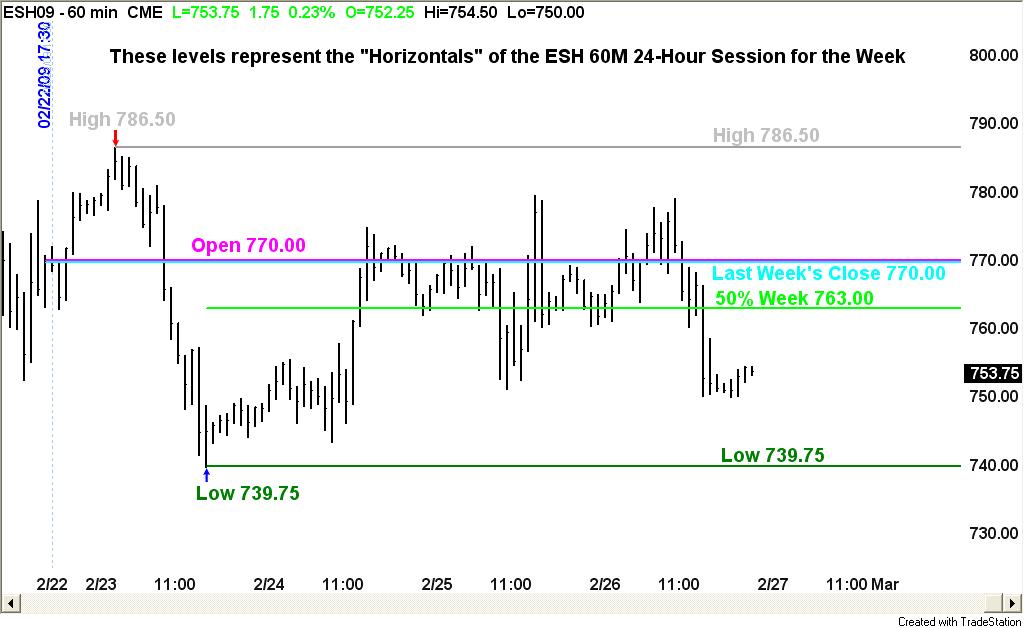
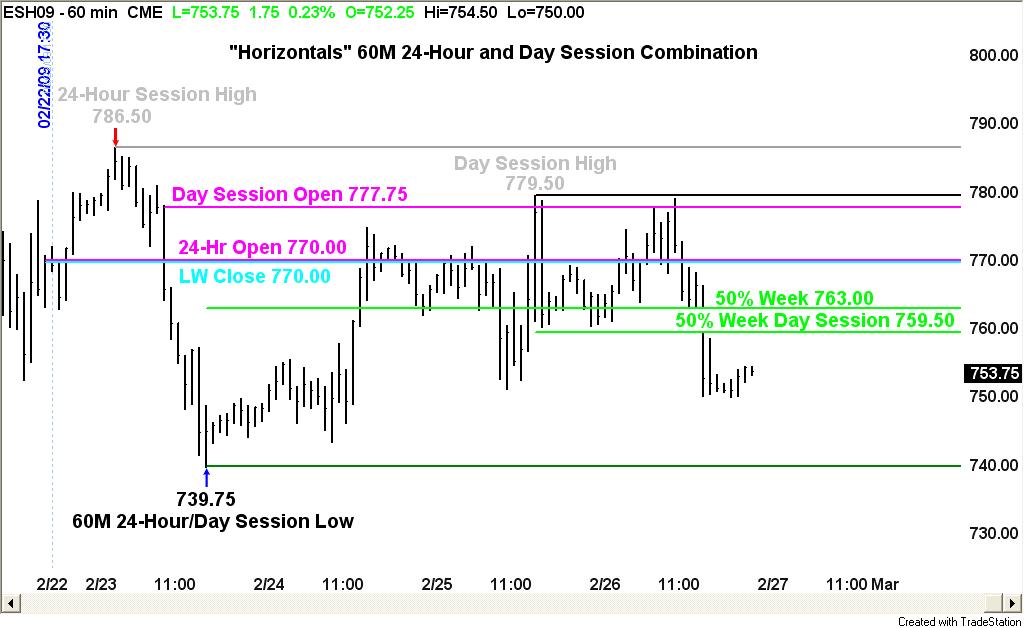
Here are three charts of the Horizontals for the week. Chart 1 is the Horizontals for the 60 Minute 24-Hour Chart. Chart 2 is the Horizontals for the 60 Minute Day-Session Only Chart. Chart 3 is the Combination of the 60 Minute 24-Hour and Day-Session Chart
From this example one can see how the market is attracted to these horizontal support and resistance zone. The opening price on the daily and weekly charts combined with the 50% price for the week often forms major support and resistance for the week.
After the opening of the market on the first day of the week, it is very important to draw this horizontal price on your chart as this price will remain an important reference price throughout the week. It is also important to place the previous week’s close on the chart also. As the week develops, you should fill in your chart with the high and low for the week as well as maintaining the 50% price for the week. These prices will yield important information about the trading action all week.
Study these charts to get a clue as to what the market has been doing this week so far. If anything you should notice that 24-Hour and Day-Session charts can and will make different patterns. This tells you that Time is also a major influence on the market action. If this type of analysis is new to you then it is suggested you test and experiment before applying this study to real time markets. In future articles I will show you how to combine the horizontals with the diagonals and the verticals.
Chart 1: ESH 60M 24-Hour Session for the Week

60 Minute 24-Hour Session Chart: Note the “chop zone” between 50% Week and Last Week’s Close at 763.00 and 770.00 respectively.
Chart 2: ESH 60M Day Session for the Week

60 Minute Day-Session Chart: Having trouble with Monday’s opening. Closed on bearside of last week’s close, the week’s open and 50% for the week.
Chart 3: ESH 60M 24-Hour and Day Session Combination

60 Minute 24-Hour and Day Session Combination: Note how very little time the market has spent above 770.00, and how much time it has spent between 763.00 and 770.00.
James A. Hyerczyk is a registered Commodity Trading Advisor with the National Futures Association. Mr. Hyerczyk has been actively involved in the futures markets since 1982 and has worked in various capacities from technical analyst to commodity trading advisor. Using W. D. Gann Theory as his core methodology, Mr. Hyerczyk incorporates combinations of pattern, price and time to develop his daily, weekly and monthly analysis.
His published works include articles for Futures Magazine, Trader’s World, SFO Magazine, Forex Journal, and Commodity Perspectives (Commodity Research Bureau), and, his book Pattern, Price & Time published by John Wiley & Sons, Inc. in 1998.
Click here to sign up for a free, online presentation by Larry Connors, CEO and founder of TradingMarkets, as he introduces The Machine, the first and only financial software that allows traders and investors to design and build quantified portfolios.
