How to Successfully Trade the Russell 2000 E-mini Futures, Part 1
The S&P 500 futures are obviously king of e-mini index markets. More traders work that symbol than all other e-mini index futures combined. But, popularity as measured by volume does not always mean superiority of profit potential. Other e-mini markets exist for valid reasons… some darn good ones at that.
ES futures are most liquid, most popular, and most churned by blackbox computer programs of all. Using the term “efficient market” would definitely rate the ES as most efficient = least profitable to trade because of that. The ES spends more time going sideways in consolidation patterns and/or pulling back inside directional periods (back & fill) than any of the other e-mini index symbols. That fundamental truth is due to professional-level players working big orders with varied agendas which have absolutely nothing to do with accumulation or distribution patterns. Hedging to offset blocks of stock, SPY shares, SPX option positions, intermarket positions such as ES/NQ spreads are all part of the intraday influence on S&P 500 futures.
Click here to learn how to utilize Bollinger Bands with a quantified, structured approach to increase your trading edges and secure greater gains with Trading with Bollinger Bands® – A Quantified Guide.
In addition to that, numerous blackbox computer programs exist solely for the purpose of scalping sideways profit potential from ES markets versus something else. Either the arbitrage spread between ES and SPY, ES and SPX options, ES e-mini futures versus SP00S pit-traded futures and their mismatched bid/ask spreads, etc. In other words, a lot of big money positions trade inside the ES with absolutely no regard to direction. Matter of fact, these program types work to keep price action sideways by arbitraging price discrepancies between different symbols.
It is that constant pressure on ES from both sides by myriad market players most of the day, every day which creates persistent sideways price behavior or “chop”. Some retail traders develop strategies to take advantage of that predictable sideways behavior the ES has, to a degree, that no other e-mini index market does. There are also periods of time where the ES is directional and trending, too. Overall it is the most congested e-mini symbol with the least amount of straightline price movement on a consistent basis, for the reasons described above amongst many others.
Russell 2000 Futures
By far the most dynamic e-mini index future of all is the Russell 2000 (TF) contract. Based on small-cap stocks, it is a general market proxy and leading indicator to where all other index markets usually head… including the S&P 500. In other words, the TF contract is a leading indicator for all. It has been a leading market indicator for years, and will probably continue to be the ultimate broad market “tell” far into the future as well.
More importantly, the TF futures contract is a highly tradable instrument itself. In the past from inception to September 2008 it traded on CME exchange. Since September onward it is listed on the NYBOT (ICE) exchange and trades apart from other e-mini index futures listed on the CME. That in itself is actually a great benefit to this symbol, which didn’t seem likely at the time. Russell 2000 e-mini traders worried that the ER2 leaving its home base at CME in exchange for a different exchange would ruin the contract. It did result in lower volume traded, for a couple of reasons. Part of that was the usual uncertainty that any change in life creates. The other part was an absolute explosion of volatility = implosion of stock markets right when the migration from ER2/CME to TF/ICE occurred. Former ER2 players were dealt with dual variables of a new symbol/exchange inside extreme price movement through the entire marketplace. That shifted many would-be TF traders into other symbols or sidelined cash until the dust settled.
Now that the dust has settled, we learned that the TF futures are a bit more extreme on both ends of behavior than former ER2 was. When the TF is going directional, it is a straight arrow with nil pullbacks or counter moves. When TF is going sideways, it will roll through a wider hi-lo pattern now than it ever did before. This “new” behavior is attributed to TF being listed on a different exchange than ES and NQ. Whereas before the old ER2 was easily cross-margined in spreads that arbed price variances between the symbols, now the margins required are much higher for such spreads between ES or NQ and TF.
In the past if ER2 was out of balance with ES or NQ, i.e. the tapes diverged, spread traders could short one/long the other which would essentially rein in the ER2. That type of sideways throttling relationship no longer exists between them, because margins are fractional within CME products spread. In order to trade the same arb spreads between ES/TF or NQ/TF now, it requires two full margins for each spread position.
Furthermore, when spreads within the CME were active and exchange went offline for trading access, it was no big deal. But spreads open across two different exchanges where one of those may go offline exposes the other open leg of that trade to unlimited potential loss. Spread traders abhor risk, which is part of why they trade spreads instead of linear positions in the first place. For those reasons and more, e-mini spread traders pretty much leave the cross-exchange spread arbing alone. Which is one major reason why the TF is considerably smoother and more directional than other e-minis… lack of sideways arb position pressures.
Liquid Enough?
TF futures are trading about half the overall volume that ER2 did before the change. The average daily volume in TF is roughly 150,000 contracts, whereas the ER2 did average somewhere around 250,000 to 300,000 contracts daily. Compared to many futures symbols, the present TF volume is substantial. For most retail traders, it offers enough liquidity to fill five – ten contracts with nil to minimal slippage. Larger orders will regularly clear as well, but partial fills on a single strike limit-order are possible during lulls in the tape intraday. TF traders wanting to push block size orders can easily stagger contracts across several ticks’ span to ensure complete fills in most instances.
The bid/ask spread varies from one tick to two ticks wide, occasionally more around economic reports and other known market-moving events. With a value of $10 per tick = ten ticks per index point, this may seem rangy to some. However, the fact that TF trades commonly run +4 points to +10 points from entry signal to various price objectives makes everything relative. An initial stop of -1.5 points/-$150 per contract with realistic expectations of profit exit for +5 points/+$500 per contract to +10 points/+$1,000 per contract offers an unparalleled risk/reward ratio.
These numbers are pie-in-sky randomness. Using even a -2pt initial stop while seeking +5pt profit objectives is a ratio offered multiple times daily, session after session.
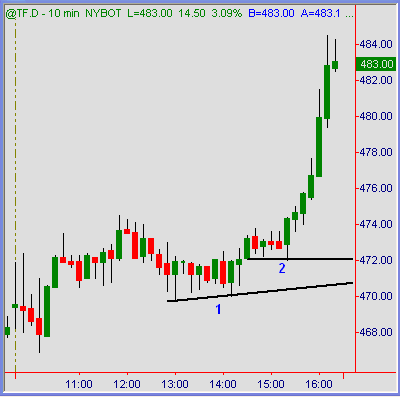
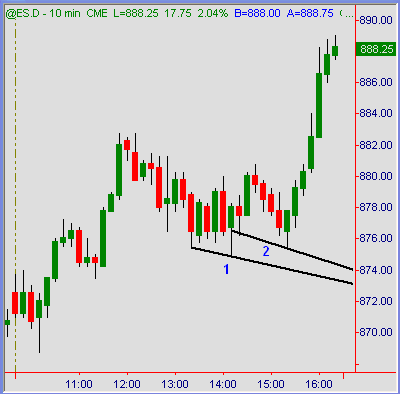
12/30 TF and ES 10-Minute Charts


In the two chart examples above, we see where price structure in the TF (upper chart) is generally more directional and trendy overall. Higher lows from 1 pm through 2 pm est (line 1) left little doubt that price action was working its way upward. Compare that to the same price structure in ES chart (lower chart, line 1) where lower lows stabbed through resting stops clustered there before lurching higher. That’s a common trap to slap out the traders who play with “magic tick” levels one or two ticks outside of prior highs or lows.
Big ES players purposely push through recent highs or lows right before immediate reversals are planned. Then again, trying to play that pattern every time will result in stopped-out trades when in fact those moves are bonafide directional breaks instead of trap reversals. Russell 2000 e-mini markets are not gamed by the big players trapping retail traders on the wrong side ahead of planned surge moves. In other words, TF trades purer and more directional than ES. Less directional guesswork is involved.
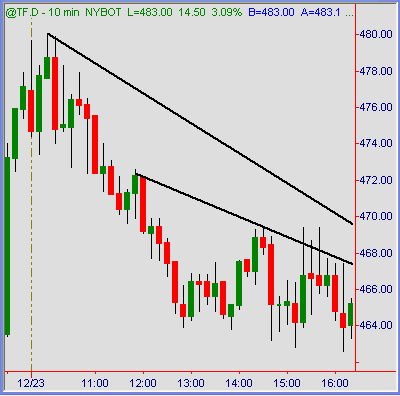
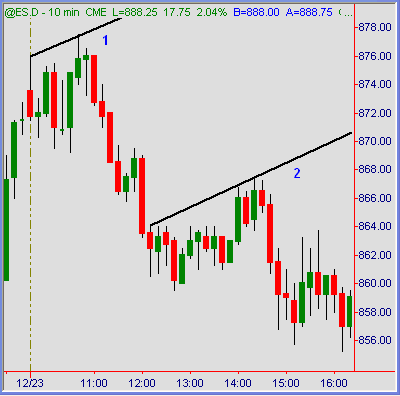
12/23 TF and ES 10-Minute Charts


Different day, same outcome. December 23rd was a trend day lower. TF futures (upper chart) rolled over soon after the open and posted lower highs all the way down. Short trades took nil heat, there was no doubt which way the trend was headed at any time.
Compare that to the ES (lower chart) where higher-highs preceded each significant price break. Blatant bull traps that fake-out buyers and stops out sellers at the same time, one fell swoop before lowering the boom with planned sell programs. Sometimes those counter-trend spikes and slams are traps. Sometimes they are legitimate directional moves. Can you ever tell which is what? Do you really care to guess which is what? Easier to follow a visible trend than it is to guess where the false moves and landmines are.
Summation
Russell 2000 e-mini futures are back, and imo better behaved than ever. They do have their limitations and pitfalls, it goes without saying there is no perfect or superior all-around symbol. If there was, everybody would trade the same thing. For those of us who like trendy, directional and dynamic price action, TF Russell 2000 e-mini futures fits that bill to a “T”.
Austin Passamonte is a full-time professional trader who specializes in E-mini stock index futures and commodity markets. Mr. Passamonte’s trading approach uses proprietary chart patterns found on an intraday basis. Austin trades privately in the Finger Lakes region of New York. Click here to visit CoiledMarkets
