Key Price and Time Symmetry Takes Precedence
From 1990 to 1997, Kevin Haggerty served as Senior Vice President for Equity Trading at Fidelity Capital Markets, Boston, a division of Fidelity Investments. He was responsible for all U.S. institutional Listed, OTC and Option trading in addition to all major Exchange Floor Executions. For a free trial to Kevin’s Daily Trading Report, please click here.
The SPX closed Friday at 683.38, or -7.0 on the week. It was the 4th straight down week, and it is -23.3 (high – low) since the Geithner “no specifics” speech day on 2/10/09, which was followed by significant declines every time Obama opened his mouth about the pork spending bills, and budget proposal. As of today, Geithner has yet to outline the comprehensive plan Obama said he would, and the market knows the administration is just cuffing it, so the market answered in kind with red sell tickets for the past 4 weeks as the SPX has declined -23.3% since that infamous “no specific” speech by Geithner, followed by Obama’s “great society” proposals and budget, none of which addresses the core problem of fixing the financial system.
In the previous commentary for 3/6/09, I mentioned that there is significant long term price symmetry from 665-605, in addition to key time symmetry through 3/20/09 so the highest probability was for a technical reversal off March lows. Suffice to say that the market has reached an extreme O/S condition, both short and long term.
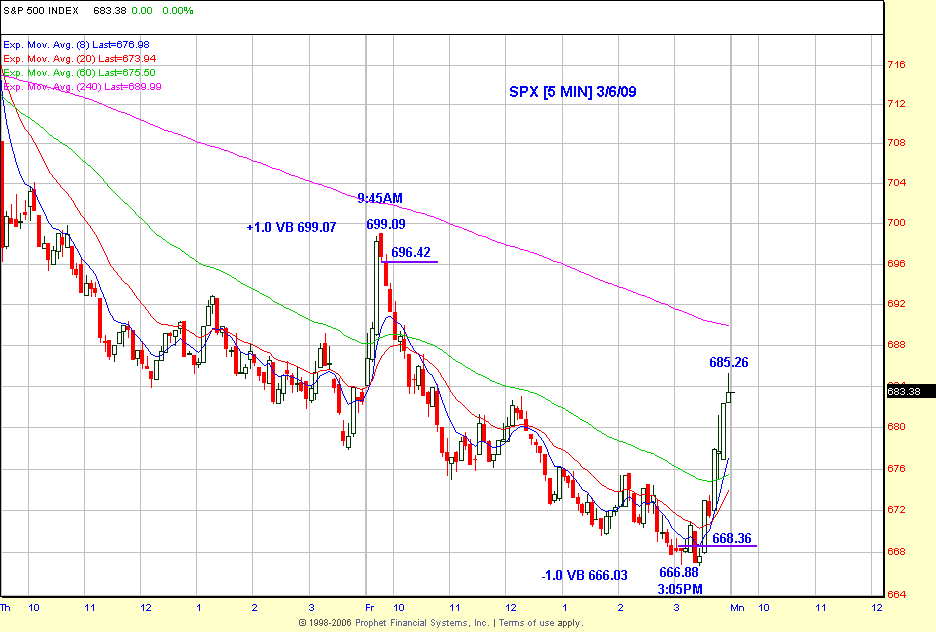
On Friday the SPX made a 666.79 intraday low versus the 665 .618RT to the 1982 low, from the 1576 bull market top on 10/11/07. Last week also had some key time symmetry, so members of the trading service were anticipating a reversal if the SPX hit this zone. There were 29 trading days from the 741 low (11/21/08) to the 944 high (1/6/09) and Friday was the 1.414 Fib extension of that leg at 41 TD’s (1.414 x 29 =41). The trader that was aware of the symmetry in advance was obviously better prepared to make a trading decision, whether it be a day trade or position trade.
I included the SPX 5 min chart from Friday which outlines the two specific Volatility Band decisions for day traders, and position traders after the 666.88 low on the 3:05PM bar, which was also an RST entry above 668.36, but I didn’t label the 5 points of the RST pattern. We got the same RST entry at the 741 level. The SPX went vertical after entry and closed at 683.38, but declined to 672.88 yesterday before closing at 676.53 (-1.0), while still holding the previous low.

The reversal will continue this morning unless Obama or Geithner get involved, and the SPX futures are +14.60 points as I complete this at 8:45 AM. Bernanke is giving what appears to be a positive speech, and the financials are all up in the pre-market, so a short squeeze in financials in addition to a run in the energy, materials, and technology stocks will be enough to carry the SPX to another + 20% or more gain off that 665 key price zone, with the 666.79 low on Friday. There have been 3 previous reversals of at least +20% from extended levels with key price and time symmetry.
Have a good trading day!
Click here to find full details on Kevin’s courses including Trading with the Generals with over 20 hours of professional market strategies. And for a free trial to Kevin’s daily trading service, click here.
