These Charts Will Show You When Not To Trade
Well, the charts are
beginning to speak to us, metaphorically speaking. Yesterday’s close
shows that the market is under a bit of pressure, how much more it will decline
is anyone’s guess. But, just as the media and everyone are triumphing the new
bull market, the storm clouds that were there the whole time are now being
noticed (see yesterday’s article for a summary).
Naturally, given that every trader I know and
respect is looking for a reversal here, also leads me to believe that we may all
be mistaken. It is too common currently for everyone to be talking about the
reversal. Just a contrarian point of view. Time will tell.
In the meantime, as traders, we need to grind out
our living. It has been pretty damn boring to say the least. A flurry of
activity in the morning then ….nothing. So with that let’s toss up a few
charts so that when you see them you will know not to trade.

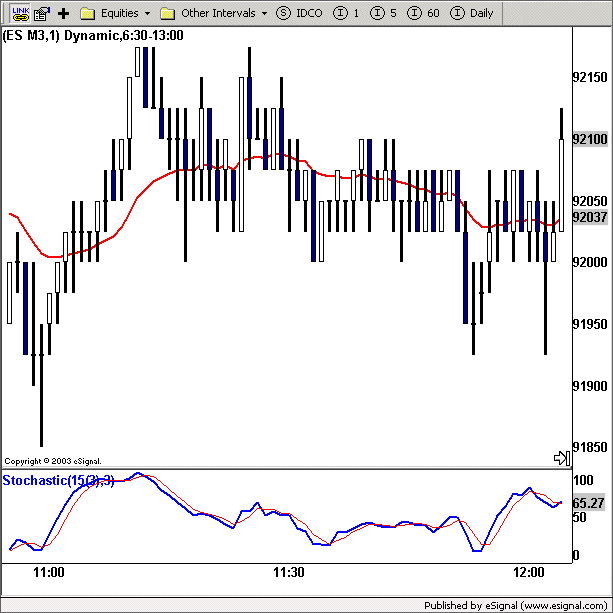
Notice how on the first chart all you have is
price bar consolidation? Where is the range, the fluidity? It is
non-existent. If you think you can trade this, you are kidding yourself.

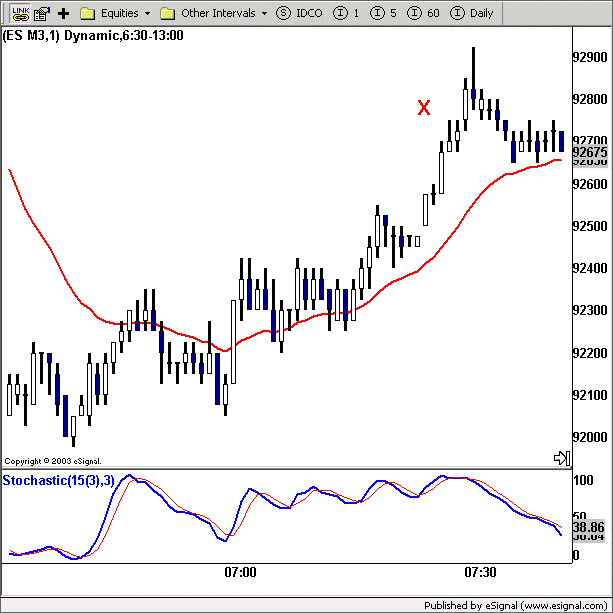
On this chart (yesterday’s opening) at least
there are some pockets where there is range expansion, most noticeably at point
X. To be frank, I did a whopping 2 trades yesterday, seriously, 2. And, I can
say with a fair degree of certainty, that based on the stocks I was watching,
Wal Mart (WMT) and
Citigroup (C), that I made the most of what was available. Were
there other set-ups? Yep. Did they fit a decent risk/reward profile given
market conditions? No way. Not for me at least. But, at the end of the day I
walked away with money in my pocket, albeit a marginal sum, but enough to show
up today and play the game again.
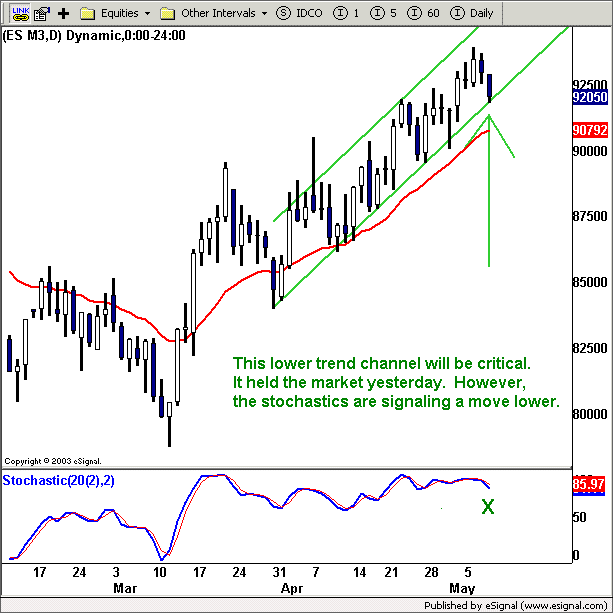
Also, if you refer back to
yesterday’s action on a 5-minute chart:

You will notice just how stubborn
the 917-18 level was. It did a great job of preventing some good selling. At
the time, I was just aware that these levels were pivot numbers. However, after
taking a look at the daily chart, it became obvious just how critical these
levels were.
So, for today, look for some good trading
opportunities in this area.
Support/Resistance
Numbers for S&P and Nasdaq Futures
| S&Ps | Nasdaq |
| 952 | 1153 |
| 945-46 | 1139-41 |
| 939-40 | 1135 |
| 933 | 1127 |
| 927 | 1121* |
| 922* | 1110-11 |
| 922* | 1100-02 |
| 916-17 | 1094 |
| 912 | 1084 |
| 905* | – |
Â
Â
Â
Â
Â
Â
My new trading service,
“Dave Floyd’s Trading Room,” through which I offer live real-time
audio commentary, analysis and alerts is now available. I encourage you to check
it out.
Click here for more information.
As always, feel free to send me your comments and
questions.
P.S. I also have a new trading module
available which teaches how to trade my HVT style through bar-by-bar chart
simulations.
Click here for information about the module.
Â
