Short term outlook: choppy waters
The stock market drifted lower
throughout last Friday’s session, but lighter volume softened the blow.
Not surprisingly, small and mid-cap stocks maintained their pattern of relative
weakness. The Russell 2000 Index fell 1.1% and the S&P Midcap 400 declined 0.9%.
The Nasdaq Composite lost 0.7%, the S&P 500 0.4%, and the Dow Jones Industrial
Average 0.3%. Each of the major indices oscillated within their respective
trading ranges of the previous day, meaning not much changed on a technical
level. A modest wave of buying late in the afternoon lifted the broad market off
its intraday lows.
Volume again declined in both exchanges, but this time the
lower turnover was positive because it coincided with broad-based losses in the
market. In the NYSE, total volume declined by 17%, while volume in the Nasdaq
was 18% lighter than the previous day’s level. Unlike a majority of recent
“down” days in the market, lighter volume this time indicated that institutions
were not aggressively selling. Instead, the losses were more the result of a
lack of strong buying interest. As we often see in the month of August, volume
levels have been pretty lethargic over the past several weeks. Friday’s session
saw the least number of shares change hands in more than a month, but many
traders and investors have begun to take their annual summer vacations.
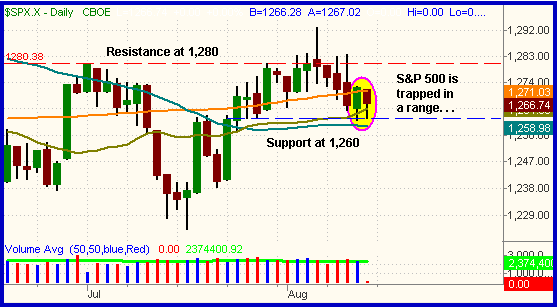
The S&P 500 declined 1% last week, but the loss did little to
change the overall technical picture of the broad market. Throughout the past
four days, the 200-day moving average has acted like a magnet for the index,
which has alternated between closing just above or below that pivotal level. The
S&P closed the week below its 200-MA, but support of both the 20 and 50-day
moving averages is right underneath last week’s closing price. Throw in the fact
that volume is likely to remain light for the next several weeks and you’ve got
strong odds that the market will chop around in a sideways range in the
short-term. As the chart below illustrates, the S&P has been stuck in a range
from the area of 1,260 to just over 1,280. Until the index firmly closes above
or below that range, we are taking it easy with entering new positions:

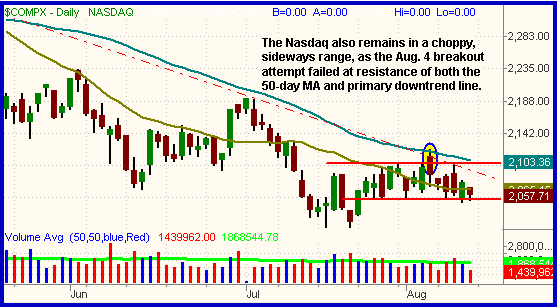
The Nasdaq Composite has similarly been trading in a tight
range from around 2,050 up to 2,098. On August 4, the Nasdaq broke out above
that range on an intraday basis, but overhead resistance of its 50-day moving
average caused the index to sell off and close back within its prior range.
Looking at the daily chart of the Nasdaq, notice how the 50-day moving average
has converged with its primary downtrend line for quite some time. Obviously,
there is no point buying tech stocks and ETFs until the Nasdaq eventually breaks
out above that confluence of resistance. Price confirmation would occur from a
closing price above the August 4 high, while a rally on stronger volume would
confirm the return of institutional accumulation:

Presently, both the S&P and Nasdaq cash futures are pointing
to significantly higher opening prices. The cease-fire between Hezbollah
fighters and Israeli troops in Lebanon has likely been a contributing factor to
this, but the big question is whether or not stocks will retain their gains
throughout the day. Most opening gaps over the past several months have failed,
as traders have used the higher prices as a chance to sell into strength.
However, we do not recommend aggressively selling short into today’s gap unless
the major indices clearly show an inability to sustain their opening gap prices.
Now is probably a good time to simply focus on managing existing positions and
building a new watchlist of stocks and ETFs for potential entry on both sides of
the market. Doing so will enable you to be prepared when the S&P and Nasdaq
finally break out of their recent ranges, though this may not occur until after
the summer doldrums have passed.
Open ETF positions:
Long
(
PPH |
Quote |
Chart |
News |
PowerRating) and
(
SDS |
Quote |
Chart |
News |
PowerRating), short
(
IWM |
Quote |
Chart |
News |
PowerRating) (regular
subscribers to The Wagner Daily receive detailed stop and target prices on open
positions and detailed setup information on new ETF trade entry prices. Intraday
e-mail alerts are also sent as needed.)
Deron Wagner is the head trader of Morpheus
Capital Hedge Fund and founder of Morpheus Trading Group (morpheustrading.com),
which he launched in 2001. Wagner appears on his best-selling video, Sector
Trading Strategies (Marketplace Books, June 2002), and is co-author of both The
Long-Term Day Trader (Career Press, April 2000) and The After-Hours Trader
(McGraw Hill, August 2000). Past television appearances include CNBC, ABC, and
Yahoo! FinanceVision. He is also a frequent guest speaker at various trading and
financial conferences around the world. For a free trial to the full version of
The Wagner Daily or to learn about Deron’s other services, visit
morpheustrading.com or send an e-mail to deron@morpheustrading.com .
