TradingMarkets Chart of the Day
For today’s Chart of the Day, let’s take a look at the
Pullback From Lows list that is published each day on the
Indicators
page. Most successful momentum-based traders and money managers like to
sell weak stocks after they pull back. TradingMarkets.com uses a proprietary
mathematical model to identify up to 20 (in strong or choppy markets there will
be fewer) weak stocks that have pulled back from recent lows. These stocks
should be considered potential candidates to resume their longer-term
downtrends. TradingMarkets’ favorite strategies revolve around these types
of pullback setups. Look for stocks that are moving against their trend,
because usually they will eventually continue in the direction of the trend.
Hansen
(
HANS |
Quote |
Chart |
News |
PowerRating) made
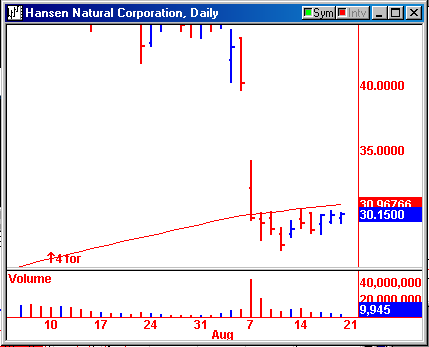
new lows on August 10, after a 25% gap down on August 7. This stock is in
a confirmed downtrend, trading just below its 200-day moving average after
its gap. After making the new lows, HANS is pushing up towards its moving
average. Watch for HANS to continue falling after testing resistance at
the MA.

Use pullbacks to catch a better price
before the trend resumes.
John Patrick Lee
