The Real Market
Given the sharp gains in
the NYSE and Nasdaq Composite indexes off their March and April lows, a period
of consolidation is perfectly natural. Those market observers who are writing
off the current rally on the basis of the floundering of big-cap tech seem to
ignore this as well as miss the fact that the rally leadership ain’t in big-cap
techs.
Some of my favorite
retailers got clipped after their breakouts, notably Hot Topic
(
HOTT |
Quote |
Chart |
News |
PowerRating) and
Charlotte Russe
(
CHIC |
Quote |
Chart |
News |
PowerRating). Otherwise, plenty of the April breakouts have
worked out nicely. Among them are International Game Technology
(
IGT |
Quote |
Chart |
News |
PowerRating),
Skechers
(
SKX |
Quote |
Chart |
News |
PowerRating), Fluor
(
FLR |
Quote |
Chart |
News |
PowerRating), Activision
(
ATVI |
Quote |
Chart |
News |
PowerRating), Loews
(
LTR |
Quote |
Chart |
News |
PowerRating),
Metro One Telecommunications
(
MTON |
Quote |
Chart |
News |
PowerRating) and Pharmaceutical Product Development
(
PPDI |
Quote |
Chart |
News |
PowerRating).Â
Following the action of
the leading stocks, a winning perspective practiced with such inhuman accuracy
by the great Jesse Livermore,
tells me more about the condition of the market than any index. As a technical
trader, I am ready to abandon my opinion at a moment’s notice. But so far,
today’s leaders are telling me to remain bullish.
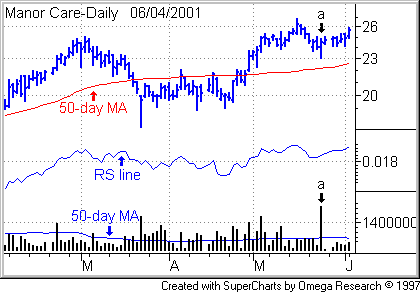
Manor Care
(
HCR |
Quote |
Chart |
News |
PowerRating) may
be setting up a high handle or platform. Note the constructive volume and price
spike (see Point a in the following chart).
The stock’s relative strength line, which tracks its performance vs. the S&P
500, is moving into new high ground.Â
Express Scripts
(
ESRX |
Quote |
Chart |
News |
PowerRating)
moved into new high ground.

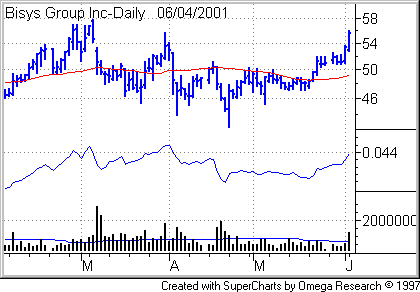
Bisys Group
(
BSYS |
Quote |
Chart |
News |
PowerRating)
is shaping the right side of a correction-recovery base.
It was a pleasure meeting
some of my fellow intermediate-term traders Saturday in Phoenix for the first
Kaltbaum/Fleckenstein seminar. Trading is usually a solitary profession. So it’s
as energizing for me as it is for you to get together with people who trade similar disciplines to my own. I look forward to seeing many of you again at
TradingMarkets 2001 in Las Vegas.Â
The top field of all
charts in this commentary uses a logarithmic price scale and displays a 50-day
price average in red.
In the second field, a blue relative strength line represents the displayed
security’s price performance relative to the S&P 500. The third field
displays vertical daily volume bars in black with a 50-day moving average in
blue for volume.
Remember that all stocks are
speculative and risky. On any trade, reduce your risk by limiting your position size to a percentage of your total
account and setting inviolable price stops. For an intro to combining stops with
position sizing, check out my lesson, Risky Business.
Â