Sequence Watch
The
market played to the probability on Friday, as
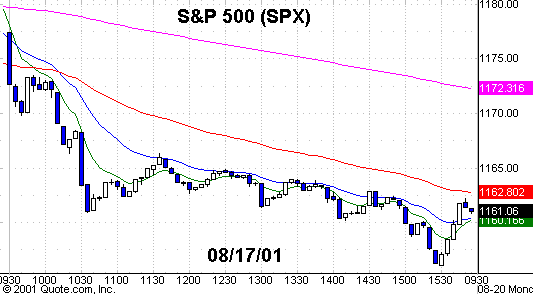
the major indexes had their biggest down day of the week. On Friday the NDX 100
(
NDX |
Quote |
Chart |
News |
PowerRating) finished -4.1%,
(
SPX |
Quote |
Chart |
News |
PowerRating) -1.7%, and the Dow -1.4%. For the week, the
ongoing tech wreck put the NDX 100 down -6.2%, while the S&P 500 ended
-2.4%. After the gap-down opening, the contra move was but three bars for the
NDX as the intraday high was 1556 on the 9:45 a.m. bar. Both indexes trended
down into the close of 1516.58 for the NDX and 1161.97 for the SPX.
After the initial rally
of 54% off the April low, which was stopped cold at the 100-day EMA, the NDX has
been in a "buy the dip, sell the rally" sequence. This is the fifth
dip in the sequence. The last three rallies have faltered at the declining
50-day EMA, which is now 1694. The intraday low in this sequence so far is 1514
on Friday. The .786 retracement to the April low is 1504.
The SPX rallied from its
March low of 1081 to its May 22 high of 1316, or 22%, before being stopped cold
right at the 200-day EMA. This, too, made a lower sequence on Friday, and the
last three rallies have also been stopped at the 50-day EMA, which is now 1206.
The .786 retracement to the 1081 low is 1131 vs. its intraday low of 1156 on
Friday. The angle of descent since
the initial rally highs is not sharp as it was made on lower-volume numbers
which essentially is sellers with only periodic probes by the institutions on
the buy side.
On Friday, the NYSE was
below average volume at 978 million with a volume ratio of just 19 and negative
breadth by -777. The Nasdaq traded less than 76% of its average volume at 1.293
billion and a volume ratio of only 16, as 1.064 billion was down volume. Breadth
was extremely negative at 1160.
On this next rally, I
expect the semis to lead, with pops in biotechs and basics. The
(
SOX |
Quote |
Chart |
News |
PowerRating) closed
at 555.54 and the .786 retracement to its April low of 454 is 510. The
(
BTK |
Quote |
Chart |
News |
PowerRating)
closed at 492.78 vs. its .618 retracement at 494 and the .786 RT is down at 445,
just a stone’s throw away the way some of these stocks trade. The .618
retracement level for the
(
BBH |
Quote |
Chart |
News |
PowerRating)s 112.44, and there have been three quick
reflex pops from this zone since July 16. The .786 level is down at 104.
What you should be doing
now is selecting the semis and biotechs for your trading plan and framing their
key levels. That will prepare you for the Change in Direction reversal patterns
that we will probably get this week.
|
(September
|
||
|
Fair Value
|
Buy
|
Sell
|
|
2.80
|
3.85
|
1.75
|
Stocks
Today
There are no real long
continuation setups certainly from the daily charts, while there are many
bottom-of-the-range closes in stocks that are below all of their EMAs, so your
continuation shorts are easy to find.
A list of semis and
biotechs to put on your screens for intraday focus and also to be aware of any
kind of Change in Direction patterns would be, in the semis,
(
KLAC |
Quote |
Chart |
News |
PowerRating),
(
NVDA |
Quote |
Chart |
News |
PowerRating),
(
NVLS |
Quote |
Chart |
News |
PowerRating),
(
TXN |
Quote |
Chart |
News |
PowerRating),
(
ADI |
Quote |
Chart |
News |
PowerRating) and
(
BRCM |
Quote |
Chart |
News |
PowerRating). In the biotechs, I would look
at
(
IDPH |
Quote |
Chart |
News |
PowerRating),
(
PDLI |
Quote |
Chart |
News |
PowerRating),
(
GENZ |
Quote |
Chart |
News |
PowerRating),
(
ENZN |
Quote |
Chart |
News |
PowerRating),
(
BGEN |
Quote |
Chart |
News |
PowerRating) and
(
HGSI |
Quote |
Chart |
News |
PowerRating).
Let’s call these the Daytrader’s Dozen. They’re not long setups on the screen
from Friday. They are just daytrade stocks to focus on because when the activity
starts, these stocks will all participate.
Also, some of the basics
to keep on your screen and watch how they trade and get involved are
(
AA |
Quote |
Chart |
News |
PowerRating),
(
AL |
Quote |
Chart |
News |
PowerRating),
(
CAT |
Quote |
Chart |
News |
PowerRating),
(
WY |
Quote |
Chart |
News |
PowerRating),
(
GP |
Quote |
Chart |
News |
PowerRating) and
(
DOW |
Quote |
Chart |
News |
PowerRating). One stock that I find interesting
down at these levels is
(
CSCO |
Quote |
Chart |
News |
PowerRating), which I find very interesting here at below
17, as the 16.40-16.75 level is where the volume came in in mid-June for a 17%
pop.
Have a good trading day.

Five-minute chart of
Friday’s SPX with 8-, 20-,
60- and 260-period
EMAs

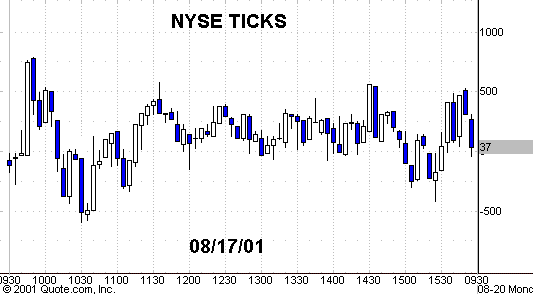
Five-minute chart of
Friday’s NYSE TICKS
Do you have a
follow-up question about something in this column or other questions about
trading stocks, futures, options or funds? Let our expert contributors provide
answers in the TradingMarkets Trading Advisor! E-mail your question to questions@tradingmarkets.com.
For the latest answers to subscriber questions, check out the Q&A section,
linked at the bottom-right section of the TradingMarkets.com home page.
