Long-Term Intraday Trend Remains Negative — Be Alert For Reversal Levels
What Monday’s Market Action Tells You
It
was the last day of the quarter yesterday, and there was also a re-balancing,
all of which meant lots of chop and a net result of nothing at the end of the
session. The Generals held the quarter enough so that the SPX
(
$SPX.X |
Quote |
Chart |
News |
PowerRating)
finished at +10.8% for the six months year to date, while the second quarter by
itself was +14.9%. The
(
QQQ |
Quote |
Chart |
News |
PowerRating)s were +22.9% for the six months and +18.6% for
the second quarter, which highlights how technology led as it initially made
higher lows, as the SPX and Dow
(
$INDU |
Quote |
Chart |
News |
PowerRating) made lower lows. This positive
divergence carried through into quarter’s end. My favorite trading vehicle, the
(
SMH |
Quote |
Chart |
News |
PowerRating)s, finished the six months year to date at +27.4%, with a +22.6% gain
in the second quarter.
NYSE volume increased yesterday to 1.56 billion,
with the quarter-ending activity and re-balancing. But volume and breadth were
neutral with a volume ratio of 49 and breadth +107. The SPX finished at the
bottom of a 10 point range, closing at 974.50, -0.2%. The Dow was about flat,
closing at 8985, the Nasdaq
(
$COMPQ |
Quote |
Chart |
News |
PowerRating) -0.2%, the QQQs +0.1%, with the SMH
-0.4%.
The market judge essentially said, “No
decision,” on Monday. All of the major sectors finished red, except retail,
with the RTH ending the session at +0.5%. I don’t read anything into the sector
activity yesterday.Â
For Active Traders
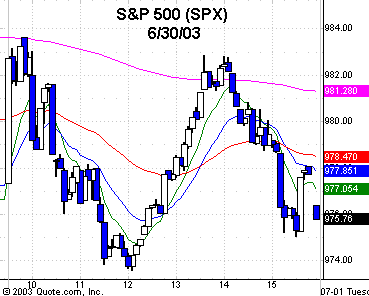
In spite of the 10 point SPX range, active
traders had opportunity, as there were about 35 points of intraday travel range.
The early emotion provided opportunity, as it always does, about 90% of the time
with a contra move, after these “general no-reason futures-induced
openings.” The first-hour reversal strategies from the module kicked in
after the early up, so you started the day in the plus column.
The first contra move down from the 983.60
intraday high on the 9:50 a.m. ET bar traded down to an intraday low of 973.60,
which took out the previous day’s low of 974.35, then quickly reversed that low
to the upside, trading to 982.36 by 2:00 p.m. Then it was down into the close of
974.50. The opening nonsense had the SMHs +2.1% and the QQQs +1.6% by 9:35
a.m.Â
How you did after the first-hour strategies
depends on how you daytrade. The move off the intraday low of 973.60 was an RST
buy entry above the high of that bar at 974.33. If you haven’t learned the RST
reversal strategy yet, maybe you just played the reversal of the previous day’s
low, which put you on the same train. I suggest you learn the RST reversal
strategy, as it bridges all markets and all time frames, so it doesn’t matter
whether you are a long-term trader, intermediate, short-term, or simply a
daytrader.
The “523” trend identification method
now has all of the major indices in downtrends. I use the 120-minute chart for
this. Yesterday was the third lower low after two previous retracements to a
declining moving average, which were lower highs. The next retracement of a
lower high to the declining moving average is at about 985.
The SPX has formed a head-and-shoulder pattern
that started to develop around June 4. The breaking of this neckline measures
down to about 931 in confluence with the 12-month EMA at 936. As active
short-term traders, you play the short side on retracements to the declining
moving average, and then prepare for the potential reversal levels which are
retracements down in a longer-term uptrend from Oct. 10 and also March 12.
Trading is reacting, not predicting.
Using the
(
SPY |
Quote |
Chart |
News |
PowerRating) as a trading plan example,
having closed at 97.47 yesterday, I will give you my outline of levels where I
will closely watch price for any potential reversal. The 50-day EMA is 95.82,
but then below that there is a more significant confluence, with the 89-day EMA
at 93.56, the .382 retracement to the 79.38 March 12 low at 93.46, and the
head-and-shoulder price objective at 93.37. Just below that is the 200-day EMA
of 92.95. That’s just a small 61 cent spread between four key inflection points,
so that should immediately get your attention if the SPX starts to cycle down
after maybe some new money gets put to work during these first few days of July.
When you are prepared in advance, you will make better decisions as price
approaches these price zones.
Today’s Plan Of Attack
Expect
the trading to be significantly slow into Thursday. If the Generals are true to
form, expect to see some new money go into various stocks that are not extended
out to extreme levels after this rally. Some money will get taken off the table
in those stocks, especially by the hedge funds. Make sure you follow my S&P
500 and NDX 100 screens this week, along with the 3-Day Wake Up Call and Change
In Direction screens. Elephants can’t hide, and if they are rotating some new
money into different stocks, we will pick it up from the screens.
Trading the index proxies, futures and HOLDRs
probably makes more sense this week into the holiday.
Have a good trading day.
Kevin Haggerty


