Maverick Is Not Engaging, Sir!
We began last week with
a number of factors stacking up for a potential short to intermediate term rally.
Those factors just to review were:
1) Fibonacci Price Support
on the major indices2) Fibonacci Time Cycles for a possible intermediate term low
3) Major Patterns against those time and price parameters that gave further
justification for an upside reversal of some sort
So our conclusion going
into last week was: Let’s be taking profits on shorts and even look for reasons
to take long trades with stops just under our Fibonacci price support zones.
We also mentioned that if this market violates these key Fibonacci price support
numbers to the downside, then this market is telling us how weak the environment
truly is out there and to expect an acceleration of what has already been a
quite aggressive sell-off over the past few weeks.
Sure enough, we got an initial
bounce off of those Fibonacci price levels early in the week. In some sectors
it carried through for a couple of days. We even hit a couple of areas to take
partial profits in some cases and moved stops up. However price action since
Thursday of last week stopped us out of a number of those long trades and left
us with that “not so fresh” feeling on others.
So what to do from here?
Here is my game plan:
The
S&P 500 SPDRs
(
SPY |
Quote |
Chart |
News |
PowerRating),
Nasdaq 100 Tracking Stock
(
QQQ |
Quote |
Chart |
News |
PowerRating), and
Biotech Holders
(
BBH |
Quote |
Chart |
News |
PowerRating), have not
yet violated price support zones and the patterns mentioned in last week’s columns
(see
Monday and
Wednesday columns) are still holding. However, if those price
support zones are broken, the short to intermediate case for a good rally fade
away. There’s no reason to “hope for a rally”. If the charts don’t show it,
then move on!
In fact, let’s say this
market does fall below our daily price support zones. Where is the next support
decision?
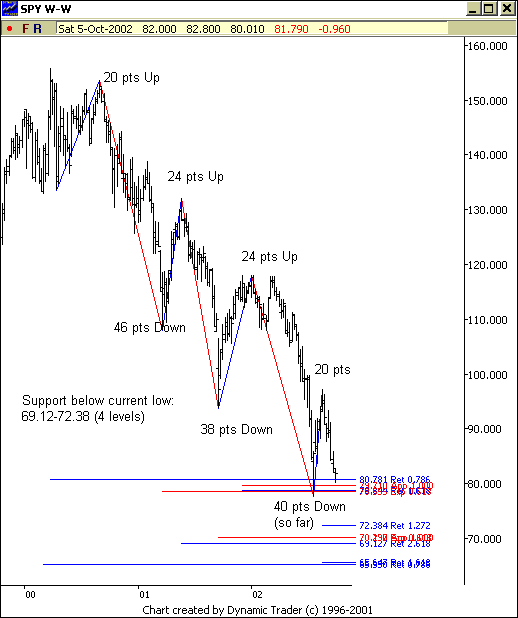
Let’s take a look at S&P 500 SPDRs (SPY). To get perspective we are
looking at a WEEKLY chart. As you can see this index ran right down into a key
weekly price support zone in late July from 78.35 to 80.78. Now, for planning
purposes, if (SPY) does trade below the July low the next Fibonacci price support
zone on the WEEKLY chart is from 65.84-72.38. The space between the current
low and this next support zone is what I call an “Air Pocket” between 78.00
and 72.00. Many times Air Pockets create a free fall experience. I’m not predicting
that, but there are no real Fibonacci price support levels or zones to hold
price up between those two levels.
To summarize: If our patterns
and time cycles against Fibonacci price support hold, then continue to have
that list of long trades available and be looking for triggers to be long. However,
if those Fibonacci price support zones are broken, look for acceleration to
the downside.

Good night!
