Film At 11:00
Yesterday was certainly one for the “film at
11″ slot. A vicious rally completely changed the tone of the
market in the short term. As of 5:30 a.m. PST, the futures have given back some
of their gains, but are still within the range of 846-51, which I consider to be
a support area. While it is never smart to make predictions, technically the
S&Ps appear poised to move higher if this morning’s pullback holds. However,
a break of 837 and it is safe to say that the market will make a run to test the
835 and 827 levels. The market is in a trading range based on an hourly chart,
and until it can make a break above 855-60 or below 800, expect some pretty
volatile trading.
I receive several e-mails each day which ask a variety of questions regarding
my trading style. Yesterday I received the e-mail below. I figured it would be a
good one to address, since this is a very common question.
I am an avid reader of your TradingMarkets column and have been studying your
high-velocity trading techniques. I
have a couple of questions for you. First,Â
I know you say that you primarily use the one-minute charts and trade
off the 20-period moving average. However, recently you said that you
have been lengthening your horizon due to lack of
short-term volatility to five-minute charts. Often when trading on the
one-minute chart, I will
get a long entry signal, but the five-minute
chart will indicate a downtrend or vice versa. Do you wait for
both to confirm each other? In which case, wouldn’t
you miss many trades?
First, yes, I base all of my trades (HVT) on
the one-minute chart. However, I use the 20-period moving average ONLY
as a reference point to determine the trend. For me to place a trade based
on a pullback, it does not have to come all the way back to the 20 period MA in order to qualify for a
trade.
That being said, when the market gets narrow and choppy, I do, as you
indicate, extend my time frame, and use a five-minute chart to base my trade
entries and exits. Your question was more specific to the five-minute as it
relates to HVT, though. I do not miss many trades as you ask simply because
the five-minute chart, specifically the trend, is in conflict with the trend of the
one-minute chart. Â
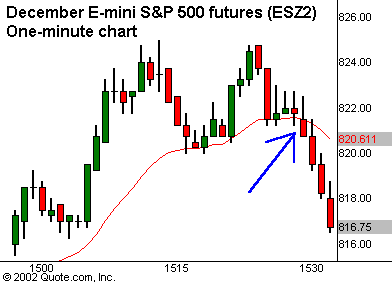
The one-minute chart below clearly shows that the trend has changed and is
now trending lower. At this point I am looking to sell short rallies in
the underlying stocks when it appears that the market is about to resume the
downtrend. If I were to base the trade on the five-minute trend, I would miss
several quality trades. Remember, I am not trading off of the five-minute
chart, so I do not use it as a prerequisite. What I do use it for is
simply as a filter to alert me of potential short-term trend changes.
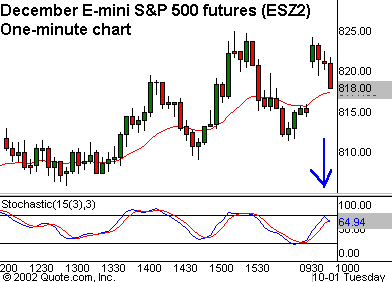
In this case, it came as no surprise that I would be shorting rallies.Â
The overbought nature of the five-minute chart, as indicated by the stochastics,
alerted me to this possibility.
So, the point is simple: use the one-minute exclusively to determine entry
and exit points for HVT. The five-minute chart is useful for placing longer-term trades or to alert you to the possibility of a near-term trend change.

You will notice that at
15:30, the trend on the one-minute chart changed. The change in slope of the
moving average to up from down is the clue. The price bars under the moving
average also confirm this. Note: Price bars below an upward sloping moving
average does not indicate a trend change.

Meanwhile, the trend as
defined by the slope of the moving average on the five-minute chart is up. Do
not let this influence your decision to short rallies based on the one-minute
chart. Rather, pay attention to the stochastics, in this case it alerts you to
the fact that “short term” the market is under pressure.Â
Key Technical
Numbers (futures):
S&Ps |
Nasdaq |
| 877 | 915 |
| *872* | *904* |
| 865 | 897 |
| *858* | *886* |
| 850 | 880-85 |
| 847 | 865 |
| 841 | 855 |
| 837 | 847 |
| 830 |
* indicates a level that is more significant
As always, feel free to send me your comments and
questions. See you in TradersWire.
