Solid
The
market gave you a day that you were prepared for, and
if you pulled the trigger, you were rewarded. The SPX
(
$SPX.X |
Quote |
Chart |
News |
PowerRating) took out
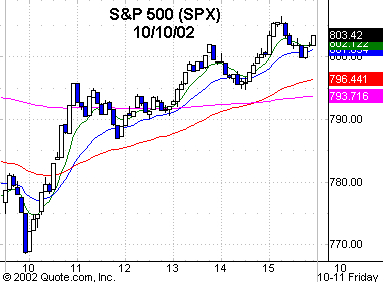
the 775.68 low, traded down to 768.63 (see the Oct.
8 commentary), and then reversed the 775.68 low and never looked back (see
the Oct.
9 commentary), trading up to an 806.51 intraday high, closing in the top of
the range at 803.92, +3.5% on the day. The Dow
(
$INDU |
Quote |
Chart |
News |
PowerRating) reversed 363 points
off the intraday low to a 7560 intraday high, closing +3.4% at 7534. The Nasdaq
gained +4.4%, and the NDX +5.2%.
The volume was excellent
at just over two billion shares, 46% above average, and certainly better than
anything we have seen in a while. The volume ratio was 81, and breadth a
disappointing +703, but not so surprising as the Generals focused on the big-cap
index stocks, which is normal as the bear tries to turn bull. The Generals
clearly spent some money yesterday, but one day a market doesn’t make.
You know I like seeing
the major sectors moving together, with the SOX +6.2%, BKX +5.4%, XBD +4.6%, CYC
+4.4% and also the RTHs which turned positive in spite of
(
KSS |
Quote |
Chart |
News |
PowerRating) while
finishing +1.9%. The semi buyers that we saw the previous day had the
(
SMH |
Quote |
Chart |
News |
PowerRating)s
+7.7% at one point, hitting a 19.06 intraday high, closing at 18.76. The Dow had
11 stocks that gained 5.0% or more, which is certainly a positive.
This reflex coming from
the extended zone was no surprise to you, as there were many confirming reasons
for you to anticipate a good reflex at any time. That was a trading day. Now
we’ll see if it turns into an investor opportunity or just another blip on the
chart.
When you get big green
days like yesterday, it might be helpful to save my stock screens to see where
the money flows. I keep the 3-Day Wake Up Call screen every day. This screen
identifies those stocks in the S&P 500 and NDX 100 that have closed above
the previous two days’ highs, have the largest daily range for three days, and
the most daily volume in three days. That obviously tells you that something is
going on. It is one of the strongest three-day buying-pressure patterns you can
find.
You should do the same
for the Change in Direction screen which identifies stocks that have made at
least a five-day low and yesterday had a higher high and low, and closed above
the high of the low day. Both screens are alerts to where the Generals put their
money, and certainly necessary to determine the quality and breadth of buying
pressure, which is reality, not just lines on a chart.
Yesterday’s downdraft set
up many daily chart RST patterns, including the SPX, and a second possible entry
RST for the Dow which was stopped out of the first one on the Sept. 30 trade.
FYI: Yesterday was such a wide-range-bar day, only take second entry after a
pullback. In the case of the Dow that had a range of 364 points, odds are it
comes back into yesterday’s range on the first pullback. Frame your pullback
levels on all the indices and HOLDRs so you’re ready to play if the Generals
return with their wallets after any retail fleecing on the opening.
Have a good trading day
and a great weekend.

Five-minute chart of
Thursday’s SPX with 8-, 20-,
60- and 260-period
EMAs

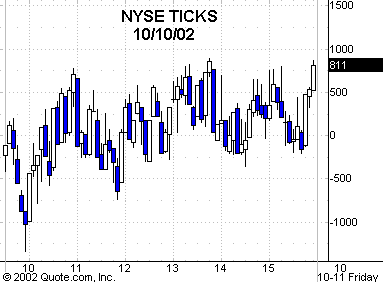
Five-minute chart of
Thursday’s NYSE TICKS
