Wednesday’s Stock Watch
Tuesday’s huge upside day
gave us an indication of follow-through from Thursday’s potential bottom,
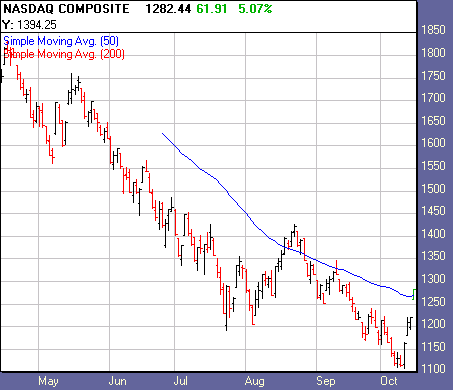
as heavy volume brought the indexes back to their 50-day moving averages.
Follow-through is a sign of institutional sponsorship for a potential bottom,
but it in no way means we’re in a new bull market. The markets are due for a
pull back, and from the bullish perspective we’d like to see it occur on lighter
volume.
We’d also like to see more stocks meeting our strict
technical and fundamental properties, but they’re not there. Not yet. There are
two new stocks on the “building a base” list, while the remaining stocks on our
“breakout list” are giving mixed results.
From Tuesday’s action:
Market breadth was positive, with NYSE
advancing issues over declining issues by a ratio of 2.90, and up volume over
down volume by a 7.01 ratio. Nasdaq advancing issues over declining issues came
in at 3.01, and up volume beat down volume by a 9.72 ratio.
The Dow Jones Industrial Average
(
$INDU.X |
Quote |
Chart |
News |
PowerRating) closed +4.80% at
8255.68. The S&P 500
(
$SPX.X |
Quote |
Chart |
News |
PowerRating)
closed
+4.73% at
881.21.
The Nasdaq
(
$COMPQ |
Quote |
Chart |
News |
PowerRating) closed
+5.07% at
1,282.44.

Â
2,323
2,500
Declining Issues
782
855
1,567,175,000
1,503,267,000
232,458,000
438,364,000
Total
Volume
1,821,716,000
1,979,424,000
Highs
14
11
6
3
Top sectors:
Health Services and Medical Appliances & Equipment.
Losing sectors:
Semiconductors, Major Airlines, Software, Telecoms, Internet,
Homebuilders, and Tobacco.
Watch List Action:
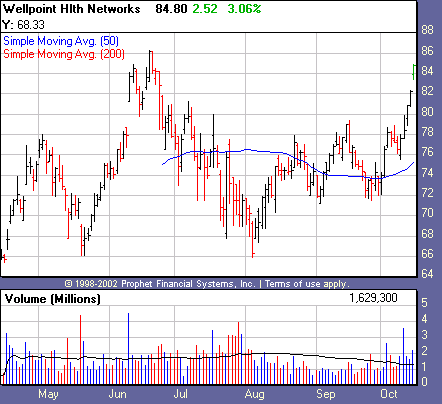
As one of our recent breakouts, Wellpoint Health Networks
(
WLP |
Quote |
Chart |
News |
PowerRating) continues to
push north on above average volume. This health management organization’s
fundamentals are representative of its sector’s strength, with its most recent
quarterly earnings up 45%, and its revenue up 37% on a year ago basis. As the
stock approaches new-52-week highs, it may pull back to form another handle.

New to our “building a base” list, Ross Stores
(
ROST |
Quote |
Chart |
News |
PowerRating) is moving nicely with
accumulation up the right side of a “W” bottom. This discount clothing retailer
has been growing its revenue consistently for the past nine years, and saw its
most recent quarterly earnings up 41% from a year ago.Â

Recent Breakouts
size=2>We monitor the action of Recent Breakouts as an indicator of
the market health for IT traders. When breakouts are acting well, this is a good
sign for the likelihood of further sustainable breakouts. When breakouts are
failing, IT traders should be even more cautious.
| color=#ffffff size=2>Company Name | color=#ffffff size=2>Symbol | color=#ffffff size=2>12 Month RS | color=#ffffff size=2>Price | color=#ffffff size=2>Price Change | color=#ffffff size=2>Average Volume | Pivot | 52-Week High |
Apollo Group | ( APOL | Quote | Chart | News | PowerRating) | 96 | 45.05 | +2.02 | 2,419,900 | 39.60 | 45.88 |
Brown & Brown | ( BRO | Quote | Chart | News | PowerRating) | 88 | 33.00 | +0.80 | 238,000 | 31.59 | Â 37.00 |
Education Mgt. Co. | ( EDMC | Quote | Chart | News | PowerRating) | 94 | 44.33 | -0.25 | 351,300 | 44.58 | 46.65 |
Hovnanian Enterprises | ( HOV | Quote | Chart | News | PowerRating) | 98 | 34.96 | +2.06 | 963,300 | 32.90 | 40.56 |
International Game Technology | ( IGT | Quote | Chart | News | PowerRating) | 94 | 69.85 | +2.49 | 904,300 | 66.70 | 71.95 |
Mid Atlantic Medical Services | ( MME | Quote | Chart | News | PowerRating) | 98 | 41.77 | +1.52 | 480,900 | 38.83 | 43.15 |
Wellpoint Health Network | ( WLP | Quote | Chart | News | PowerRating) | 95 | 84.80 | +3.96 | 1,302,800 | 79.05 | 86.27 |
Stocks Forming a Handle
| color=#ffffff size=2>Company Name | color=#ffffff size=2>Symbol | color=#ffffff size=2>12 Month RS | color=#ffffff size=2>Price | color=#ffffff size=2>Price Change | color=#ffffff size=2>Average Volume | Pivot |
None | Â | Â | Â | Â | Â | Â |
Stocks Building A Base
color=#ffffff size=2>Company Name | color=#ffffff size=2>Symbol | color=#ffffff size=2>12 Month RS | color=#ffffff size=2>Price | color=#ffffff size=2>Price Change | color=#ffffff size=2>Average Volume |
Commerce Bancorp. | ( CBH | Quote | Chart | News | PowerRating) | 82 | 45.69 | +1.00 | 736,600 |
Ross Stores Inc. | ( ROST | Quote | Chart | News | PowerRating) | 89 | 41.12 | +1.47 | 998,900 |
href=”mailto:danielb@tradingmarkets.com”>danielb@tradingmarkets.com
If you are new to the “IT” strategy, be sure to
take a look at our
intermediate-term online trading course.
Intermediate-Term Traders
Report is posted on
Tuesdays and Fridays. For other intermediate-term commentary, be sure to read
Mark Boucher (Fridays),
Tim Truebenbach (Tuesdays and Thursdays), and
Gary Kaltbaum (Mondays and Thursdays).
