Entry Patterns At Alert Zones
The primary purpose
of this lesson is to give you
something to keep on your desk which illustrates the most common
Reversal Bar
Patterns that most often precede a move in the opposite direction.
You will see these patterns at key
alert zones (inflection points) such as Pullbacks to Moving Averages,
Support/Resistance
Fibonacci Extensions and Retracements in addition to
Trap Doors
(both ways) and Volatility Bands.
The second key point is to strongly
emphasize that the alert zones are just numbers and you don’t buy or sell the
number. When the stock/future gets to the key zones, you should be looking
to enter the trade on the
Change
In Direction Pattern, with reasonable
stops to manage your risk.
Another key point I want to emphasize
is that the sequence of your identification of potential extensions and
retracement levels precedes and anticipates a reversal pattern occurring in that
alert zone.
It is most important that you don’t
enter the trade without the Change in Direction pattern. It is a fact that it
will be a higher-probability trade when it converges with the inflection point
and the Market Dynamics at the time of your trades.
The following graphic illustration
gives you eight common two- to four-bar patterns. There are other multiple bar
patterns that form up a lot after the initial patterns shown below that I cover
in my seminars.

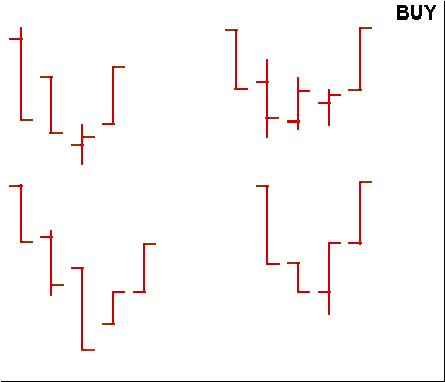

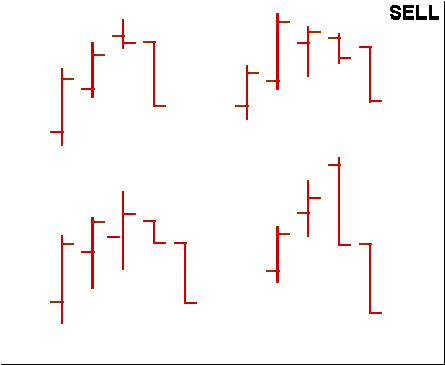
I have included five
charts (candle and bar) that illustrate inflection points combined with basic
Change in Direction patterns.
You should note that all of the pattern examples
above have setup bars with closes above the midpoint (below for sells) which
indicates some degree of buying or selling pressure.
This along with range and
volume tells you an important story.
Chart
1
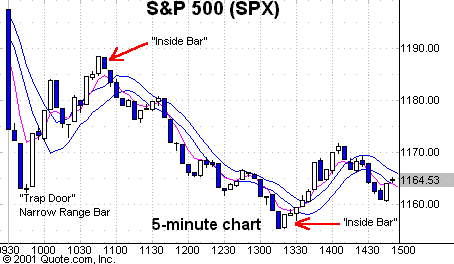
This chart gives you
examples of some patterns without tying them to the inflection points which we
will do on the next chart.
Chart
1
Five-minute Chart of S&P 500 Cash Index (SPX) with
5-period EMA of
the last sale, 8-period
high and
8-period low
moving
averages
In the chart above, you
recognize the first pattern of the day which is a Trap Door narrow-range Doji
setup bar.
After advancing there is
a 3-bar pullback setup with a Doji bar (open and close at top of range).
It makes a significant
high on a narrow range Inside Bar pattern with a close at bottom of
range.
The ensuing leg down has three different retracements back to the
8-period SMA of the high, all of which failed. Note the narrow-range bars at the
top of those setups.
The subsequent bottom, marked on chart, is another Inside
Bar Pattern with a close at top of range.
Chart
2
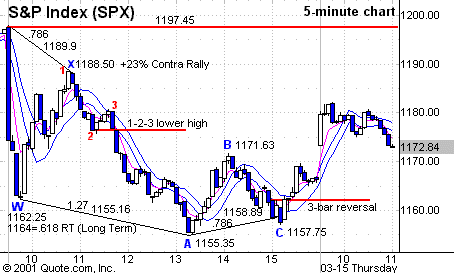
This chart is identical
to Chart 1 except that we combine some key inflection points with the basic
reversal bar patterns and it is extended in time.
Chart
2
Five-minute Chart of S&P 500 Cash Index (SPX) with
5-period EMA of
the last sale, 8-period
high and
8-period low
moving
averages
Putting numbers on the
inflection points, it plays out as follows:
The first Trap Door setup
at the 1162.25 low is excellent as it converges with the long-term .618 RT of
the October ’98 923 low to the March ’00 1553 high. 1164 is the .618 RT level.
This setup was also at an extreme volatility band.
This first leg up to X
(1118.50) was a 2.3% contra rally that ended with an Inside Bar Reversal Pattern
that was right at the .786 RT of the previous 1197.66 high (didn’t fit on
chart). The .786 RT is 1189.90.
The first part of the leg
down stopped at 2, retraced to 3, the 8-period SMA of high, gave you a
narrow-range bar reversal pattern and then a 1,2,3 short below swing point 2.
Before the bottom at A,
1155.35, note the two rally attempts that failed at the 8-period SMA of high.
The bottom at 1155.35 is exactly the 1.27 extension (1155.16) of the W to X leg
up, and also at the 2.0 Volatility Band level.
Extensions and
retracements are very common for the major Indexes and big-cap liquid stocks.
The 1.27 and 1.618 extensions are most common but extreme extensions can run to
2.24, 2.618 and 3.14. That’s why you don’t enter until you get a Change in
Direction pattern.
The rest of the chart
shows you a leg up from A (1155.35) from an Inside Bar Reversal Pattern to the
1171.63 top at B, which ended with a narrow-range reversal, trading down to a
retracement bottom at C (1157.75).
Note that 1158.89 is the
.786 RT of the A to B leg. From the C low, you got a 3-bar Reversal Pattern
that gave you another good upside pop as it also broke above the 8-period SMA of
the high coming out pf the pattern, which is high probability.
You should note
also that in the XA leg, the 1,2,3 short entry also broke below the 8-period SMA
of low.
This was certainly an
extremely volatile day but if you were familiar with this kind of sequence
trading, it was very logical and had structure.
Chart
3
I have included the same
day chart of the NYSE ticks below, which shows you a positive divergence in
ticks from -1065 to -809 as the SPX made the 1155.35 bottom at the 1.27
extension and 2.0 Volatility Band. In
“Sequence Trading,” everything is related when deciding to take a
trade.
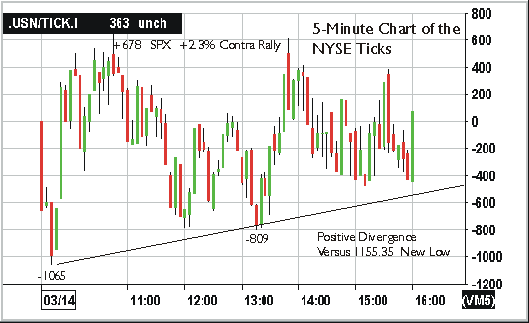
Chart 3
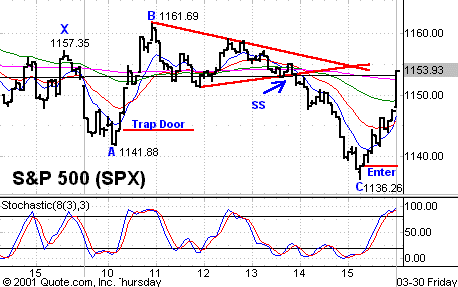
Chart 4 adds another
dimension as you see that the AB leg to the 1161.69 B Top is a 1.27 extension of
the XA leg.
The difference is that the X high of 1157.35 is from the previous
day.
It is mandatory that you check multiple days and time frames to capture
significant inflection levels.
You can observe common
reversal bar setups starting with the Trap Door, extension top reversal bar, and
then a defined Symmetrical Triangle that comes out the bottom, below all of its
EMAs.
There was a good pop into the close from the 1136.26 bottom at C which is
right on the 1.27 extension (1136.53) of the AB leg up.
Chart
4
Five-minute Chart of S&P 500 Cash Index (SPX) with 8-,
20-,
60-
and 260-period
EMAs
AB = 1.27 XA @ 1161.52
BC = 1.27 AB @ 1136.53
Chart
5
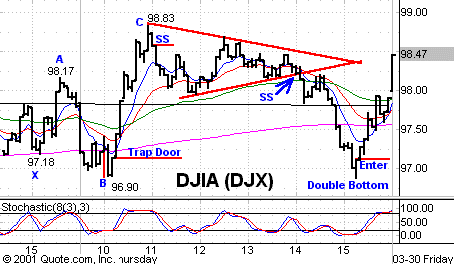
This chart is meant to
give you another building block to the “Sequences.” The Dow dropped like a
knife on the opening and down to 96.96 where you got a Trap Door reversal setup.
You could have taken the
earlier narrow range Trap Door but probably would have been stopped out below
the low of the narrow-range bar as it traded to 96.90 especially in current
market conditions.
The Trap Door after the
low of 96.90 was an exact 1.27 extension (96.91) of the XA leg up from the
previous afternoon.
The BC leg was a 1.618
extension of AB at 98.95 right at the C top of 98.83.
After that, it was the
same as the SPX in Chart 4, except the bottom before the last run up was a
double bottom with your basic reversal bar entry pattern.
Chart
5
Five-minute Chart of Dow Jones Industrial Average (DJX) with
8-, 20-,
60-
and 260-period
EMAs
AB = 1.27 XA @ 96.91
BC = 1.618 AB @ 98.95
Summary
If you keep this lesson
on your desk and do the work, and adhere to your stop disciplines,
you will
be profitable.
Click here for a Free 1-Week trial to Kevin Haggerty’s Volatility Bands
