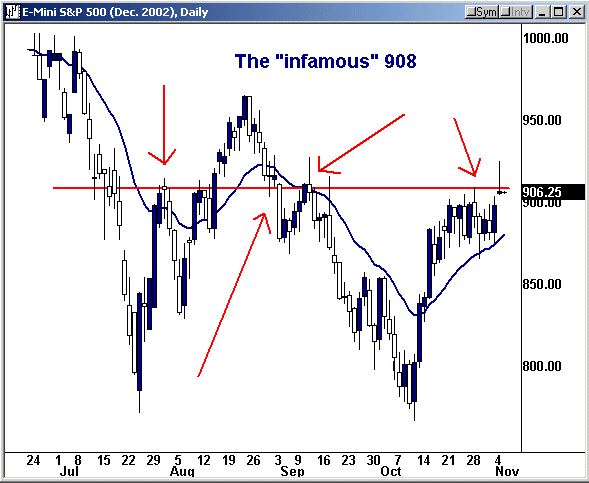
The Infamous ‘908’
First of all, thanks to all of you who sent me an
e-mail regarding
yesterday’s article. Your comments were appreciated, and do not
worry, comments such as those do not sway me, in fact, it turned out that it
provided a great way to stress an important point which escapes many
traders/investors.
Despite breaking out of the recent trading range, the market did little to
stir much intraday enthusiasm. Trading (HVT)
was again restricted to the opening and close, all the while being incredibly
selective and perhaps a bit more generous in terms of waiting for the trade to
develop. Using the five-minute chart in conjunction with the one-minute chart
proved helpful.
What I am beginning to find rather interesting is just how pivotal the 908
level is becoming. As can be seen on the chart below, several turning points
have occurred here recently. Upon taking a closer look, it became quite clear
that this level will dictate price action in the days to come, as many Gann
lines conveniently intersect right there, too. Also, if you looked at Derrick
Hobbs’ article on Friday, you will also know that he was seeing indications of a
Fib time cycle coming due. I also had seen that development late last week, Nov.
6-8 to be specific. This also conveniently coincides with the wrapping up of the
FOMC meeting. Hmm. You can’t make this stuff up.

So what do we do? For me, my recent long positions (established back on Oct.
23 in my non-trading account), will be under close scrutiny. I will not let some
great gains evaporate, I can always get back in. Given how fickle the market has
been, locking in profits is more imperative than ever.
Staying with the longer-term theme (several days to weeks) for
a moment, if in fact the market kicks in and makes a decisive move, up or down,
I will be keeping a close eye on these levels:
Potential Shorts:
HD — 26.30-26.50, a break of this level would be bearish.
KO —Â Critical support at 42.73, refer to weekly chart.
Potential Longs:
ALTR —Â 12.65 level has been cleared, see if it holds.
APCCÂ –Â Breakout above 12.50, looking for pullbacks.
DNA — Looking for a close above 36.
MUÂ — I can’t believe I would even consider a pig like this one, but,
let the charts speak, not my opinion. A close above $18 is a positive.Â
From an HVT standpoint, I will continue to play my cards close to my
chest. There are no big whale trades, it is truly a game of jumping in and
jumping out. Hang around the trough too long and you will lose your
profits. Cutting back your share size and extending the time frame will see you
through.
Naturally, with the FOMC meeting ending tomorrow, I expect very little
in way of “quality” trading after the morning session. So, you decide, hang
around and try to play the noise, or rest up and prepare for what may
potentially be some good trading as Nov. 6-8 approaches.Â
Key Technical
Numbers (futures):
S&Ps |
Nasdaq |
| 932 | 1072 |
| 925 | 1066 |
| 916 | 1062.50 |
| 912 | 1058 |
| 908 | 1050 |
| 903 | 1049.50 |
| 899 | 1038.75 |
| 895 | 1027.50 |
| 890 | *1023* |
| Â | 1008 |
* indicates a level that is more significant.
As always, feel free to send me your comments and
questions. See you in TradersWire.
