Two Ways To Adjust To The Volatility
The
SPX
(
$SPX.X |
Quote |
Chart |
News |
PowerRating) opened up on Friday,
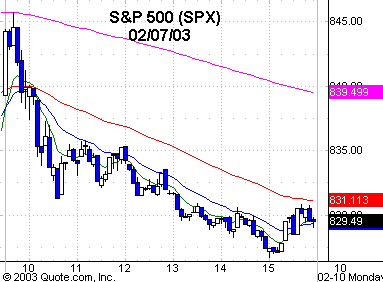
ran to the 20-period EMA on the 60-minute
chart, and then reversed. It was trend down for the remainder of the session, as
the terror alert news dominated trading. That’s not going to change any time
soon, but we must still prepare our daily trading plan according to the
buying/selling pressure that we can identify, and then adjust to the volatility.
Two ways to do that are:
-
Adjust your size to the
volatility, which is simply smaller-sized trades and wider stops. -
Moving to a higher
intraday time frame. I prefer the 60-minute time frame, as you get some very
defined patterns at many of the key levels, making it easier to identify
reversal or continuation trades. The problem with that is if you only trade,
say, the E-mini futures or the index proxies, you won’t get lots of trades, but
the ones you do get are very high probability. If you also trade stocks and have
software that allows you to scroll quickly through your intraday charts, then
you will find plenty of 60-minute chart trades.
The other primary reason
you might move to a higher intraday time frame is if you are getting chopped up
in the five-minute-or-less time zone. This constant news volatility will force
you into many scalp-like trades with constant stops, and 99% of you can’t — and
shouldn’t — be involved in that kind of trading. It’s the fastest way to trader
burnout and failure there is.
The major indices all
closed in the bottom 25% of their ranges Friday on outside-bar patterns, but
also on declining volume for the second day in succession. It’s a case of no
bids, as opposed to heavy general selling. The indices are in a high-probability
reversal zone down through 808 on the SPX and 21.69 on the
(
QQQ |
Quote |
Chart |
News |
PowerRating)s. The
Nasdaq
(
$COMPQ |
Quote |
Chart |
News |
PowerRating) has a six-point pattern confluence between 1273 and 1266,
with the .786 level down at 1197. The SPX and QQQ charts can be viewed in my
Jan. 27 commentary.
The daily task of
identifying key levels doesn’t change, in spite of the terror situation at home.
We can’t control that part of it, and from a daytrading standpoint, it just
increases volatility, which is an asset, not a liability. From a position
standpoint going forward, you should get yourself an option education, and I
will continue to remind you of that as we go.
On Friday, there was an
index proxy trade that was available and taken, which at worst case is buying
the index down 15%. It makes money anywhere above that, with a maximum return of
41% and 17% if unchanged. I will continue to take more combination trades like
that on the way down on any sharp declines.
For today, the primary
intraday trend doesn’t turn positive for me until the SPX trades above the
8-period EMA at 832.68 and the 20-period EMA 838.45. That’s on your 60-minute
charts. Those moving averages, of course, change dynamically during the day.
Looking at the VIX, you have a 38.52 close, with the 10-period EMA at 36.92.
NYSE volume declined again on Friday to 1.2 billion. The three- and four-day
moving averages of the volume ratio are short-term oversold at 27. Breadth was
-1088 on Friday with a four-day moving average of -725. It’s not exactly the
July or October oversold numbers, but for what now is still a retracement, it is
short-term oversold, and this is also evidenced by an array of other sentiment
indicators.
That’s the market side of
it, but the reality side of it is what will or won’t happen? What young person
is going to switch from money market to equity funds where they will be taking
cabs to lower Manhattan and other cities instead of subways in fear of what
might happen? That is precisely why I prefer combination trades in this kind of
market.
Have a good trading day.

Five-minute chart of
Friday’s SPX with 8-, 20-,
60- and 260-period
EMAs

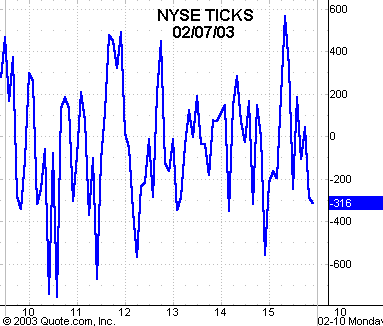
Five-minute chart of
Friday’s NYSE TICKS
