The Patterns I’m Looking At For Today
NYSE
volume was the lightest this year at 1.06 billion,
the volume ratio 27, and breadth -819.
Not a surprise after a three-day rally to get an opposite day for the major
indices. Yesterday’s high for the SPX
(
$SPX.X |
Quote |
Chart |
News |
PowerRating) was 851.17, so any
continuation long breakout entry should be above Tuesday’s 852.87 high, as
yesterday was an inside day. The SPX is also in the middle of that 840 – 870
previous trading range and right at the 20-day EMA of 850.44.
There were two defined
trading opportunities in the
(
SPY |
Quote |
Chart |
News |
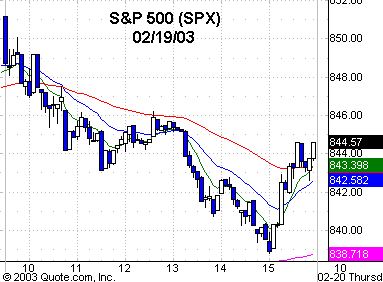
PowerRating) yesterday. The short trade came from a
Slim Jim breakout below 84.92, which was also below the 8-, 20- and 60-period
EMAs on your five-minute chart. Entry was on the 1:15 p.m. ET bar. You might
have already been short below the previous day’s closing range low of 85. This
trade carried down to the intraday low of 84.28. This was a sequence we were
prepared for. 84.28 was right on the rising 20-period EMA on your 60-minute
chart. It was also right at the intersection between Friday’s 84.20 high and
Tuesday’s 84.39 low. See yesterday’s commentary. The 84.28 low on the SPY
corresponded with the 838.79 SPX low yesterday, and guess what, it was also the
1.0 volatility band.
You had a sequence for a
high-probability trade. Your entry could have been to just fade price right at
the intersection using a one-minute chart for an early read with your initial
stop just below the 20 EMA on the 60-minute chart or else waited for the first
reversal bar on the five-minute chart. This was the same bar as the 84.28 low
and was an outside bar with a close in the top of the range and above the
previous five closes. Entry was at worst above the 84.49 high of that bar. The
trade carried to 85.18 and closed there. In summary, your sequence was a
pullback to the intersection at a rising 20-period EMA on a 60-minute chart and
right at the 1.0 volatility band on the SPX. You could have traded either the
futures or the SPY.
The
(
QQQ |
Quote |
Chart |
News |
PowerRating)s had the
same opposite day as the SPX and Dow
(
$INDU |
Quote |
Chart |
News |
PowerRating), closing at 25.08 vs. its
50-day EMA of 25.02 and 89-day EMA right above at 25.14. The QQQs traded down to
a 24.71 intraday low, which was just above the previous day’s 24.68 low and
right on the 20-period EMA of your five-minute chart. You like to see
consolidation at an intersection.
The major indices are
right at their moving averages, which might be used as pivot points either way.
Yesterday’s inside bar opposite day vs. the previous day’s top of the range
close on a gap bar is a continuation pattern that will force some traders in
above 85.80 on the SPY, 25.34 on the QQQs, and 81.05 on the
(
DIA |
Quote |
Chart |
News |
PowerRating)s.
Certainly there must be a pick-up in volume because the Generals are not on the
floor in size these past few days. That is never good. A catalyst is needed.
Futures are early green,
so refrain from that first continuation entry during the first 15 minutes of
trading.
On the stock side, I look
to consolidating volatility patterns if the buyers show up today. Some examples
are
(
PCAR |
Quote |
Chart |
News |
PowerRating),
(
AMGN |
Quote |
Chart |
News |
PowerRating),
(
APOL |
Quote |
Chart |
News |
PowerRating),
(
PD |
Quote |
Chart |
News |
PowerRating),
(
JNPR |
Quote |
Chart |
News |
PowerRating),
(
APA |
Quote |
Chart |
News |
PowerRating),
(
SYMC |
Quote |
Chart |
News |
PowerRating), and a stock that is basing below the lines
and I see some institutional buying in is
(
HD |
Quote |
Chart |
News |
PowerRating).
Have a good trading day.

Five-minute chart of
Wednesday’s SPX with 8-, 20-,
60- and 260-period
EMAs

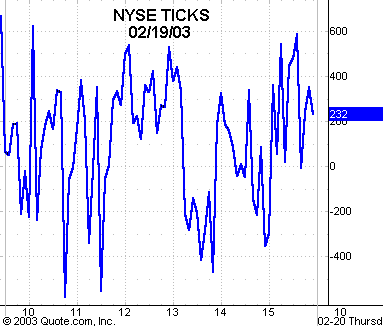
Five-minute chart of
Wednesday’s NYSE TICKS
