Return On Equity: How I Use It To Find Stocks With Fuel To Keep Rising
I’m a trader, not a quant.
I buy off
price-and-volume signals, not valuation metrics. But the intermediate-term
momentum trader still targets companies with fundamental traits most likely to
drive cash into, or out of, stocks.
For bullish trades, the prime
fundamental trait is earnings growth. But some level of earnings growth is no
great feat. After all, if a company plows part of its profits back into the
business, it starts the following year with greater resources to raise sales and net
income.
True leaders deliver powerful profit
growth even after factoring out this effect. The gauge for this kind of growth
is return on equity, or ROE.
Return on equity is yearly net income
divided by shareholders’ equity straightforward, then multiplied by 100 to
convert the ratio into a percentage. Most ROE calculations add a company’s
beginning and ending equity for a given year and divide that sum by 2 to provide an average for
the year.
As a general rule, the higher the
return on equity, the better. A high or improving ROE indicates management’s
ability to deliver the most bang for the buck. Strong ROE tends to be a good
forecaster of strong future earnings growth. I find ROE most useful to identify
leaders within an industry.
As the following tables show, a steady
ROE requires high earnings growth, whereas modest growth, all other things being
equal, can lead to a falling ROE. Weakening ROEs often portend earnings growth
deceleration to come.
|
Year |
Base Equity |
Net Income |
Net Income Growth |
Return on Equity |
| 1998 | 35.0 | 10.0 | 29 | 25 |
| 1999 |
45.0 | 12.9 | 29 | 25 |
| 2000 | 57.9 | 16.5 | 29 | 25 |
| 2001 | 74.4 | 21.2 | 29 | 25 |
| 2002 | 95.6 | 27.3 | 29 | 25 |
| 2003 | 122.9 | 35.1 | 29 | 25 |
| 2004 | 158.0 | 45.1 | 29 | 25 |
Source: Timothy P. Vick,
Wall Street on Sale (McGraw-Hill 1999)
|
Year |
Base Equity |
Net Income |
Net Income Growth |
Return on Equity |
| 1998 | 35.0 | 10.0 | 15 | 25 |
| 1999 | 45.0 | 11.5 | 15 | 23 |
| 2000 | 56.5 | 13.2 | 15 | 21 |
| 2001 | 69.7 | 15.2 | 15 | 20 |
| 2002 | 84.9 | 17.5 | 15 | 19 |
| 2003 | 102.4 | 20.1 | 15 | 18 |
| 2004 | 122.5 | 23.1 | 15 | 17 |
Source: Vick
When assessing a company’s ROE, run a
parallel check on its debt-to-equity ratio. All things being equal, greater debt
is undesirable. However, because rising debt reduces equity, it inflates the ROE
ratio. So as a general rule, discount improving ROEs that coincide with rising
debt.
Watch out for the effects of one-time charges on ROE. Charges marking down a company’s asset base lower equity in turn, shrinking the denominator and generating a higher ratio.
equity)
Sustaining high ROE in the absence of
rising debt is no small accomplishment. For a case in point, business valuation
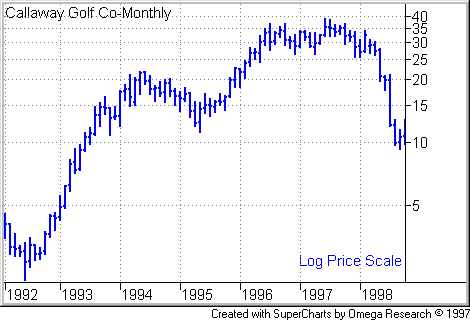
expert Timothy Vick cites Callaway Golf
(
ELY |
Quote |
Chart |
News |
PowerRating), which delivered ROEs
averaging 43% between 1993 and 1997 while retiring long-term debt, an
extraordinary accomplishment. Those years coincided with a terrific run in Callaway’s share price.

For The Best Trading
Books, Video Courses and Software To Improve Your Trading
