This Was The Exact Stuff You Want To See
Ahhhh, earnings season, or at least a taste of it. Nothing could be better
for setting up some nice volatility than earnings. For those of you who were
trading Home Depot
(
HD |
Quote |
Chart |
News |
PowerRating) on the opening, the
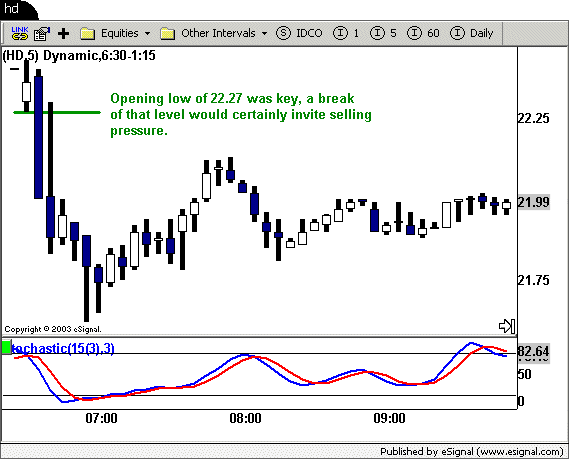
stock offered a nice bounce to the downside shortly after the opening.
I have captured the setup in the image below for reference.

In this case, much to my surprise and the guys in the office, HD opened
pretty much unchanged after reporting earnings. Typically there is more of a
reaction. However, like any opening where either the S&Ps or the stock gap up/down, the opening low or high is very important. In this case, the opening low
was $22. For me, the trade developed according to all the normal parameters that
I look for in a short sale:
- Trend is down.
Â
- A slight rally back toward the 20-period EMA.
Â
- Stochastics overbought and on the verge of crossing back down.
Â
- In this case (a special, but valuable piece), the potential for a break
below the opening low on the heels of some earnings news.
Once all these pieces came together, it was pretty much a lay-up, take the
trade and let it play out. This trade was above average simply because the
downward thrust happened very quickly with no drawdown while in the trade. Naturally, once the S&Ps exhausted themselves on the move lower,
it was the time
you wanted to book profits.
The afternoon session offered something that has been lacking in recent
sessions, follow-through. I was hesitant frankly in the afternoon. How many
moves had never amounted to anything in the last few weeks? Too many. For me,
it was playing the moves the second time, or what I call the counter, counter
move. At least by allowing for that, I feel comfortable knowing that there are
at least a few “players” around that can move the market vs. me trying to
pick every little potential breakout.

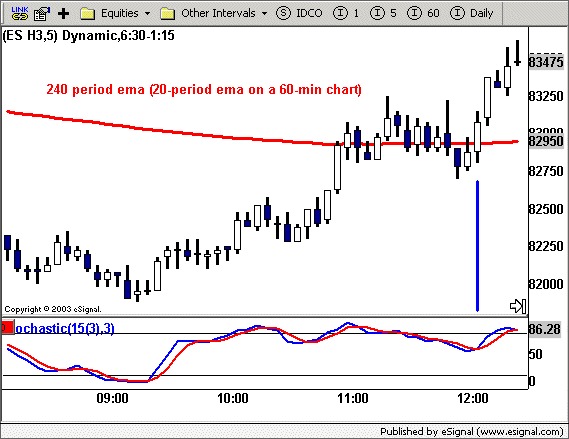
The follow through on the trade during the last half-hour of the session was
the exact stuff you want to see on every trade.Â
- A consolidation below key resistance (240 EMA).
- A pullback in an uptrend.
- Stochastic crossing up from an oversold condition.
There were a couple of stocks that reacted nicely (probably more), but I was
looking at
(
HPQ |
Quote |
Chart |
News |
PowerRating) and
(
IBM |
Quote |
Chart |
News |
PowerRating)
at the time, both worked out fine and tracked the S&Ps up brilliantly. The
good thing about these markets is that when the downtrend from the last few days
is tested, it brings out the buyers in force.
For those of you who are familiar with Elliot Wave analysis. Both the 60- and
120-minute S&P futures completed a Wave 5 down on 2/13. Since then we have been
tracing out A, B and C waves which have created some pretty chaotic trading. The
wave count, on these time frames at least, is not very clear. 856 will continue
to be the defining level in my opinion for the S&Ps and 808 on the downside.
The result is, I do not read too much into yesterday’s rally…yet. Yes, it was
impressive and on good volume, but is does not help clarify the action in the
days ahead just yet.
Note from 5:30 AM PST on 2/25:Â The
two paragraphs above were confirmed when I
woke up this morning. Futures down 4 points. This market is truly unique and
erratic.
Key Technical
Numbers (futures):
S&Ps |
Nasdaq |
| 866 | *1039-44* |
| *856* | *1018-24* |
| 850 | 1006 |
| 846.7 | 998 |
| *841* | 991 |
| 832-33 | *970-74* |
| 828 | *962* |
| 822-24 | Â |
| 814 | Â |
| 808 | Â |
Don’t forget, my new book, “How
I’ve Achieved Triple-Digit Returns Daytrading…4 Hours A Day” is now
available. Order today and you will receive a 10% discount.
As always, feel free to send me your comments and
questions.
PS: Buy my book, and get a
FREE 2 Week Trial to my Daytrading Service.
Click here for more details.
