Popular Sentiment Indicators And How I Use Them
At the end of
1999 and the beginning of 2000, the Nasdaq was cooking. Biotechs,
Internets and Technology
seemingly
could not be stopped. Bullishness in the market was
running rampant. Investors’ expectations were sky-high and rising. Analysts had
recommendations with targets of four figures. Newsletter writers were telling
you to back up the truck.
Fast forward to
February
2001. The Dow and S&P 500
had
sustained
intermediate-term
corrections. The Nasdaq was
down a whopping 53% from its March 2000 high. Many
famous tech names
were down more than 70% and a bunch of Internets
had already
said bye-bye.
You would have expected
them
to have much less optimism in the markets. In
fact, you would expect downright pessimism.
But
these talking
bulls hadn’t budged.
One of the most popular gauges of sentiment and my favorite comes from a company
called Investors Intelligence. This company tracks newsletter writers.
Many years back, Investors Intelligence decided to follow these writers’
opinions in order to decipher which way the market was headed. They figured that
if all these writers were bullish, it would be a good sign to be in the market.
Were they in for a surprise? After years of study, they found the polar opposite
was true. It turned out that these writers were trend followers and would only
turn bullish or bearish after the move.
Thus,
I consider the
bullish newsletter number a great contrarian indicator. In
the past, when optimism
has gone
to extremes, it
often
preceded market tops. When
pessimism hit extremes, it
often
signaled a bottom. While 55% bulls would
appear
to me to be
a
worrisome number, 35% bulls would
be time
to consider buying. Most people believe
it is a mistake to
watch
these numbers. I disagree. While I will
always believe market action holds the most weight, when these numbers go to
extremes, they have worked quite well for me as a secondary indicator
of
where the market cycle might be.
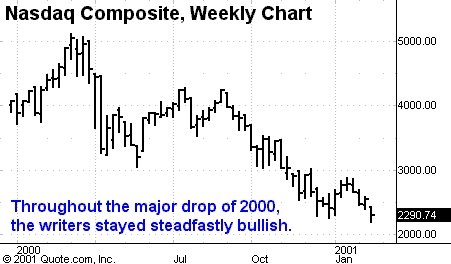
Here are some facts to chew on:
-
Throughout the major
drop of
March 2000
until February 2001, the
newsletter
writers
stayed steadfastly bullish.
At
the beginning of February 2001, and not so coincidentally after the move up,
the bulls hit
61.8%,
which is a 14-year high.
I
viewed
this as a worrisome number.
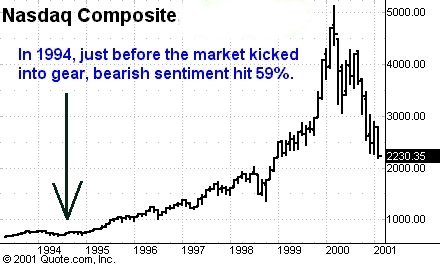
- In 1994, just before the market
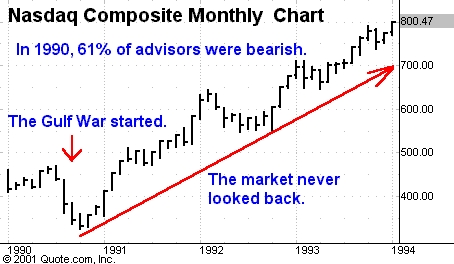
kicked into gear, bearish sentiment hit 59%. - In 1990, during the recession, more
than 55% of the advisors were bearish. The Gulf War started and the market
never looked back. - In 1987, 61% of advisors were
bullish all the way into October. I don’t think I have to refresh your
memory as to what happened next.
These are just a few moments in
history when these numbers went to extremes. Keep in mind, these extremes do not
happen very often. I urge you to start paying close attention to this indicator,
as it has
been
very uncanny when
extremes have occurred.
You can find this number every day on the market page of Investor’s Business
Daily.
Look for my next report where I will discuss put/call ratios, magazine covers,
short interest and other sentiment indicators.
Here For A Free 1-Week Trial To Gary Kaltbaum’s Intra-Day Alerts Service