Monday’s Stock Watch
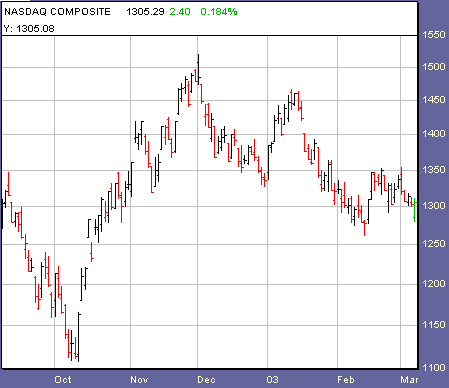
The major averages lost
ground for the week as the NYSE and Nasdaq racked up two days of accumulation
apiece. We have to be happy to see the up days sponsored by more
volume than the down days, though price action rules, and the trend has been
down. Overall volume remains well below average as players remain sidelined due
to geopolitical tension. On a positive note, Friday the indexes were able to
close positive after gapping lower on a huge disappointment from employment data.
Shaking off bad news is crucial if we’re going to rally.
In the breadth department we have a modestly
negative bias as New 52-week Lows maintain a slight edge over the Highs, and
Mark Boucher’s
Bottom RS and ER List gives us bearish reading over 20, while the
Top
RS and ER List is mostly quiet.
Stocks on our watch lists are hanging in for the
most part, and we’re seeing some encouraging signs as
(
COH |
Quote |
Chart |
News |
PowerRating) makes an all-time
high. Still the search goes on to no avail for top stocks meeting our
exceptional technical and fundamental criteria.
From Friday’s action:
Market breadth was mixed, with NYSE advancing issues over declining
issues by a ratio of 1.23, and up volume over down volume by a 1.82 ratio. Nasdaq declining issues over advancing issues came in
at 1.13, and down volume beat up volume by a 1.65 ratio.
Dow Jones Industrial Average
(
$INDU.X |
Quote |
Chart |
News |
PowerRating)
closed +0.86%
at 7,740.03. The S&P 500
(
$SPX.X |
Quote |
Chart |
News |
PowerRating)
closed +0.82% at
828.89.
The Nasdaq
(
$COMPQ |
Quote |
Chart |
News |
PowerRating) closed
+0.18% at
1,305.29.

1,636
1,491
Declining Issues
1,399
1,653
825,608,000
574,274,000
503,250,000
827,690,000
Total
Volume
1,344,439,000
1,425,856,000
Highs
16
9
62
18
Top sectors:
Internet, Gold and Silver, Software, Drugs, and
Fiber Optics.
Watch List Action:
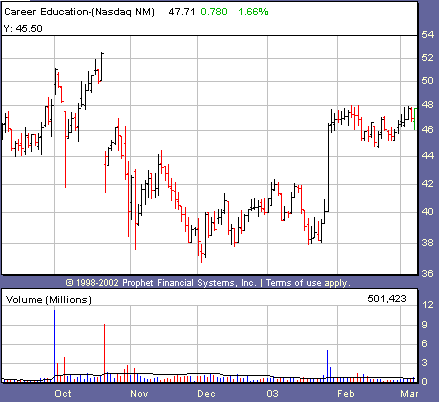
Cocked in a handle, Career Education Co.
(
CECO |
Quote |
Chart |
News |
PowerRating) put in an accumulation day
Friday, its sixth in four weeks. We have a pivot buy point on this one at
48.07. The chances of this one succeeding are reduced due to the fact that it is
in a late-stage base. By looking at the weekly chart you can see the chop that
has built up in the top of the chart in a sign the stock is losing steam. The
last breakout didn’t have much success, so this one will likely not have any
either. We will watch and see.

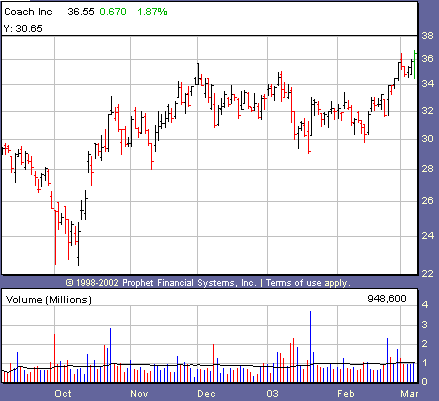
Hitting an all time high Friday, Coach Inc.
(
COH |
Quote |
Chart |
News |
PowerRating) is pushing out of a four-month consolidation pattern. We’ve been tracking this one for six months. Unlike
the situation with CECO above, this one has a stronger weekly chart, though
unfortunately a weak overall market to support it.

Recent Breakouts
size=2>We monitor the action of Recent Breakouts as an indicator of
the market health for IT traders. When breakouts are acting well, this is a good
sign for the likelihood of further sustainable breakouts. When breakouts are
failing, IT traders should be even more cautious.
| color=#ffffff size=2>Company Name | color=#ffffff size=2>Symbol | color=#ffffff size=2>12 Month RS | color=#ffffff size=2>Price | color=#ffffff size=2>Price Change | color=#ffffff size=2>Average Volume | Pivot | 52-Week High |
Coach Inc. | ( COH | Quote | Chart | News | PowerRating) | 91 | 36.55 | +0.82 | 1,070,100 | 28.35 | 35.70 |
Garmin Ltd. | ( GRMN | Quote | Chart | News | PowerRating) | 96 | 32.00 | -1.35 | 459,200 | 23.46 | 32.07 |
International Game Technology | ( IGT | Quote | Chart | News | PowerRating) | 85 | 77.40 | -1.18 | 1,189,500 | 74.84 | 80.10 |
Stocks Forming a Handle
| color=#ffffff size=2>Company Name | color=#ffffff size=2>Symbol | color=#ffffff size=2>12 Month RS | color=#ffffff size=2>Price | color=#ffffff size=2>Price Change | color=#ffffff size=2>Average Volume | Pivot |
Apollo Group | ( APOL | Quote | Chart | News | PowerRating) | 90 | 46.39 | +0.05 | 1,696,200 | 45.84 |
CECO | ( CECO | Quote | Chart | News | PowerRating) | 87 | 47.71 | +1.21 | 765,000 | 48.07 |
Expeditors International of Washington | ( EXPD | Quote | Chart | News | PowerRating) | 85 | 33.98 | -0.21 | 740,600 | 34.54 |
UCBH Holdings | ( UCBH | Quote | Chart | News | PowerRating) | 79 | 42.27 | +0.17 | 177,100 | 45.20 |
Stocks Building A Base
color=#ffffff size=2>Company Name | color=#ffffff size=2>Symbol | color=#ffffff size=2>12 Month RS | color=#ffffff size=2>Price | color=#ffffff size=2>Price Change | color=#ffffff size=2>Average Volume | Pivot |
None |
If you are new to the “IT” strategy, be sure to
take a look at our
intermediate-term online trading course.
Intermediate-Term Traders
Report is posted on
Tuesdays and Fridays. For other intermediate-term commentary, be sure to read
Mark Boucher (Fridays),
Tim Truebenbach (Tuesdays and Thursdays), and
Gary Kaltbaum (Mondays and Thursdays).
