What The SPY May Do When It Hits This Important Zone
I want to review the weekly and daily charts of
(
SPY |
Quote |
Chart |
News |
PowerRating) and
(
QQQ |
Quote |
Chart |
News |
PowerRating).
There is a story unfolding here and I’ll communicate what I’m reading. I will
also continue my saga with the Homebuilders.
Here are the bullet points before
I get started:
- SPY is
at critical weekly Fibonacci price resistance. - QQQ
has hit my objective zone on the weekly charts and facing major Fibonacci
price resistance. - Symmetry
is key on the daily charts. If immediate symmetry support is broken, look
for a move to the next zone of higher degrees of symmetry. - Although
I’ve been shaken every way to Sunday on Lennar
(
LEN |
Quote |
Chart |
News |
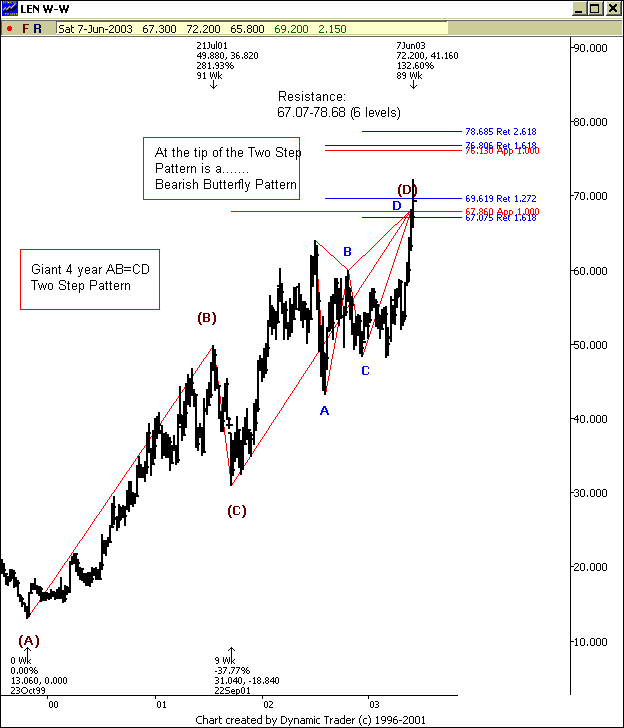
PowerRating), the big weekly
resistance zone is proving to be a critical zone. Watch symmetry on the
daily charts for hints of deeper selling.
Now, let’s look at the charts. First the weekly chart of
SPY.
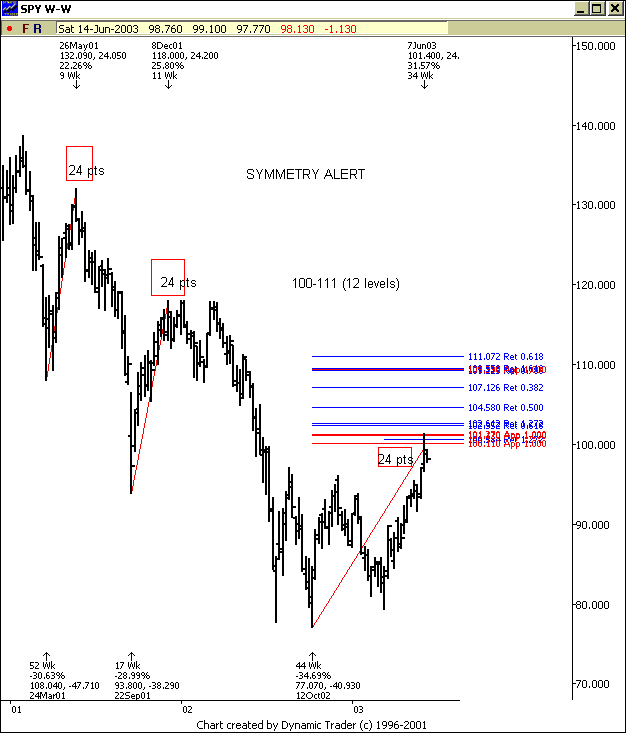
Below you’ll see that the last two major rallies have been right at 24 points.
Through last week’s end, guess how large this rally from the lows have
been? That’s right — 24 points! Mix that with the fact that we have a giant
confluence of multiple Fibonacci price levels acting as resistance, and I can’t
ignore the possibility for this up move to lose some steam in this zone.
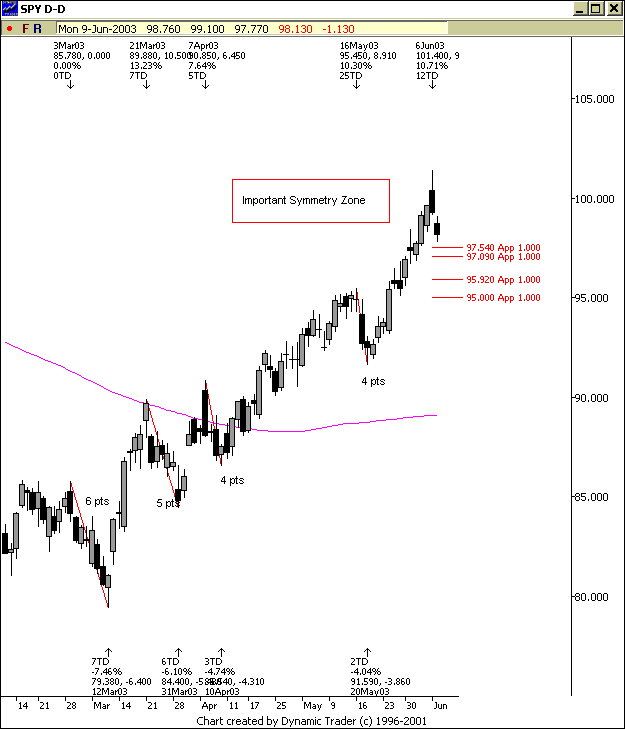
Now, below I have only highlighted daily symmetry levels.
Basically, if SPY falls below the stated support zone on the chart, it will
violate the corrective decline symmetry of this immediate uptrend. That is an
early indication that we will likely move into a bit larger corrective decline.
However, if this symmetry holds…we could move higher. This is an important
price zone on the daily level.
Next, we have the
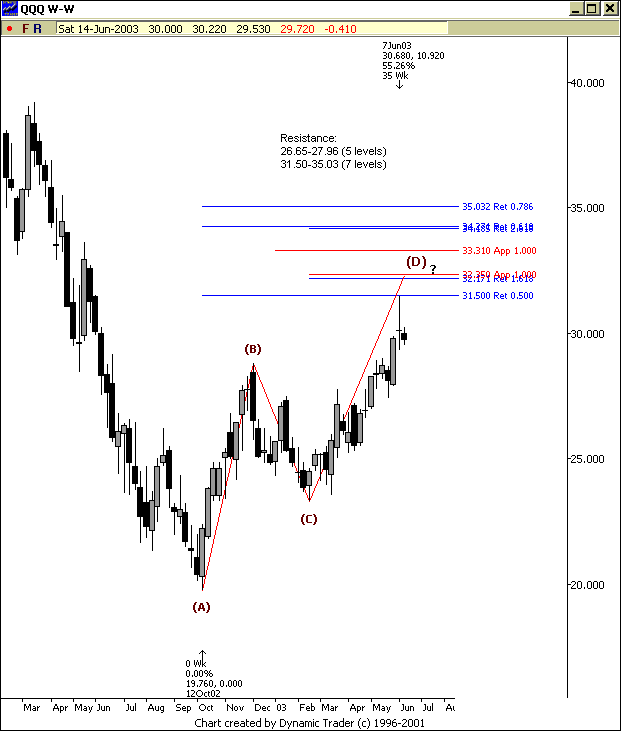
QQQ weekly chart. It has complete a
two-step corrective pattern into resistance.
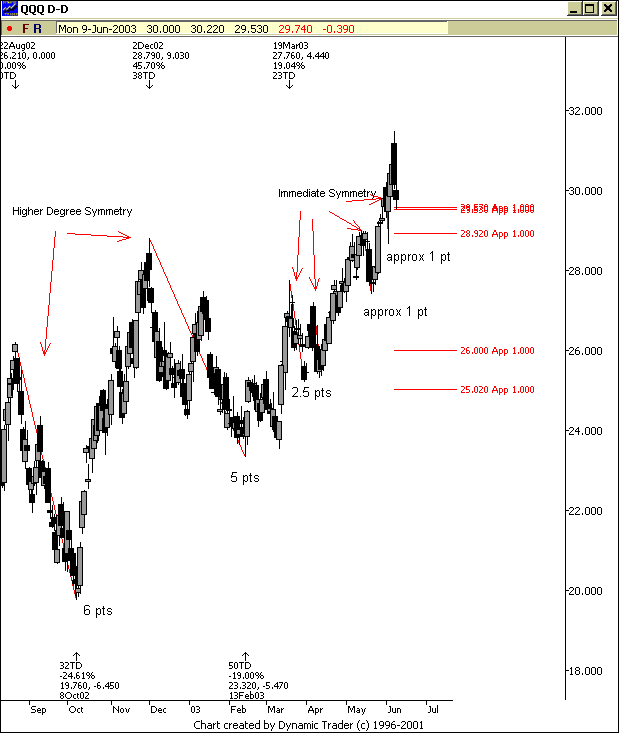
A clue that the weekly chart is starting to have a downside
impact on this ETF is if we violate immediate symmetry support. The declines in
this immediate uptrend have been right around 1 to 2 points.
If this one goes any deeper than that, it will likely
move to the next higher degree of symmetry which
would be a 5- to 6-point corrective decline.
On to the
Homebuilders…..
First, I will again visit the weekly chart of
Lennar
(
LEN |
Quote |
Chart |
News |
PowerRating) below.
The weekly zone has contained upside movement for the short term. However, the
shorter term trading environment has been extremely tough. I got whipped out of
the initial short, and as we moved into the Air Pocket where in earlier columns
I stated we would likely head to 75, we got a sharp reversal at 72 and change.
In hindsight would I do the same thing again? Absolutely! My parameters for
taking trades were there. At that point it’s up to probabilities. In Blackjack
when the dealer shows 16 (and has to hit to a hard 17) and you are dealt an
“11†you double down EVERY TIME. Why? Because the probabilities are in your
favor for a WIN. Regardless of what
happened on the last hand you make the same decision with “11†in that
scenario.
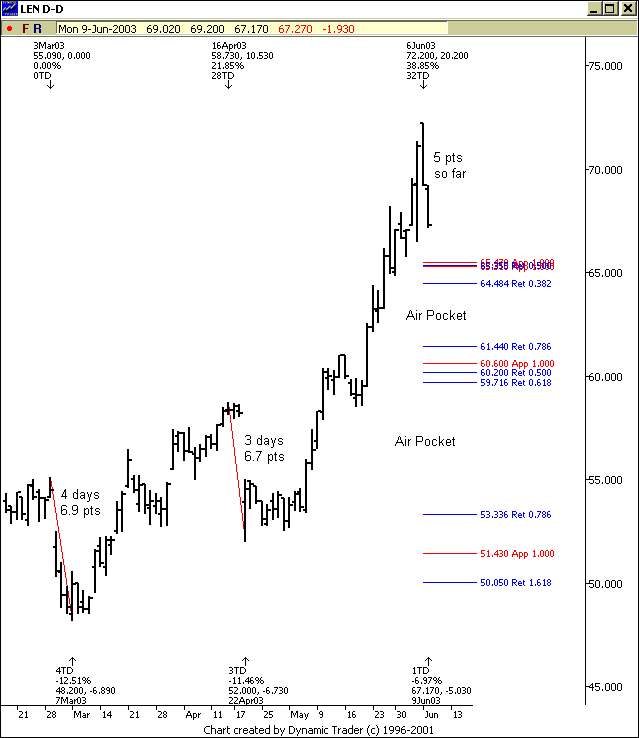
Looking at the daily chart I see two important Fibonacci
price zones which are 64-65 and 59-61. Since March 2003 the corrective declines
have been no larger than 7 points. There have been two to be precise and have
lasted 3 to 4 days. We are down 5 points from the current high and approaching
symmetry support. If that support zone is violated the next likely stop is 59
to 61.
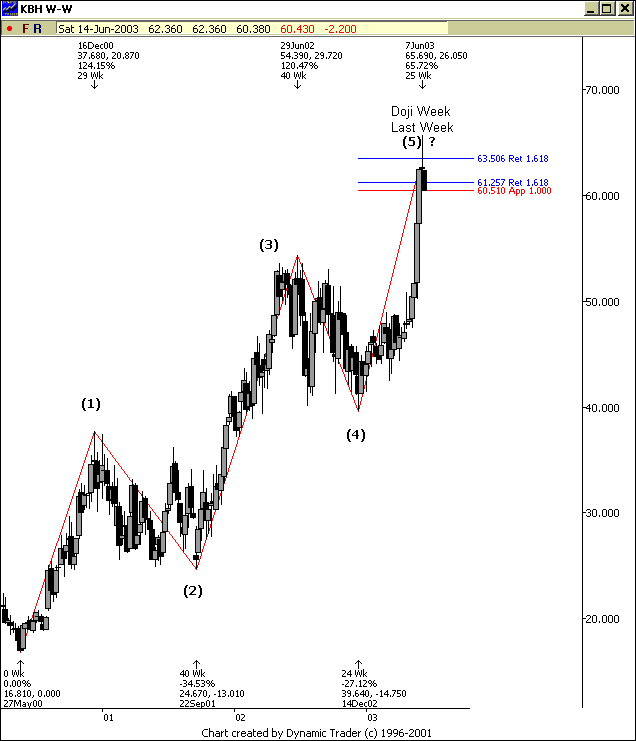
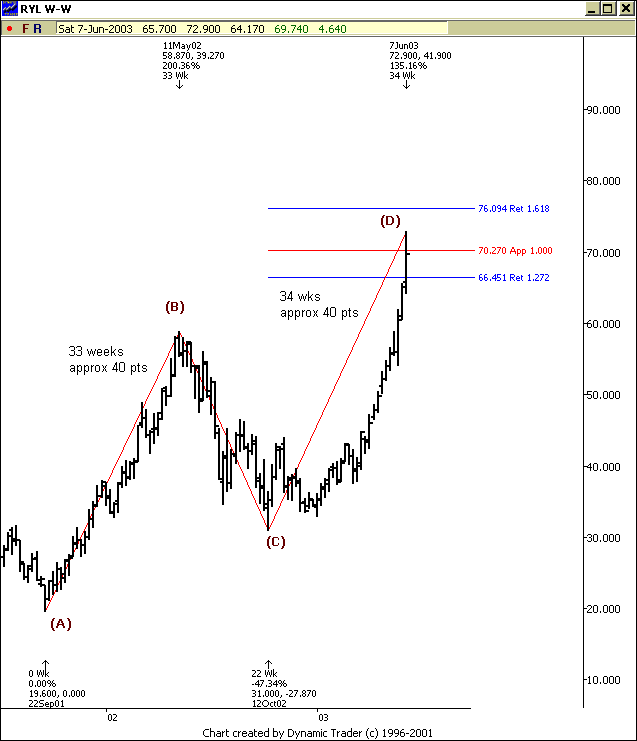
Finally here are a couple more Homebuilder weekly charts
that have hit key weekly price resistance zones and have put in a potential
reversal pattern. Like I’ve said since I opened the book on Homebuilders a few
days back. Worst case…start taking profits in this group and trailing stops. No
need to give it all back. It is an extended market and is subject to a 20-30%
downside draft…which is all in the confines of an uptrend.
Good night all!
